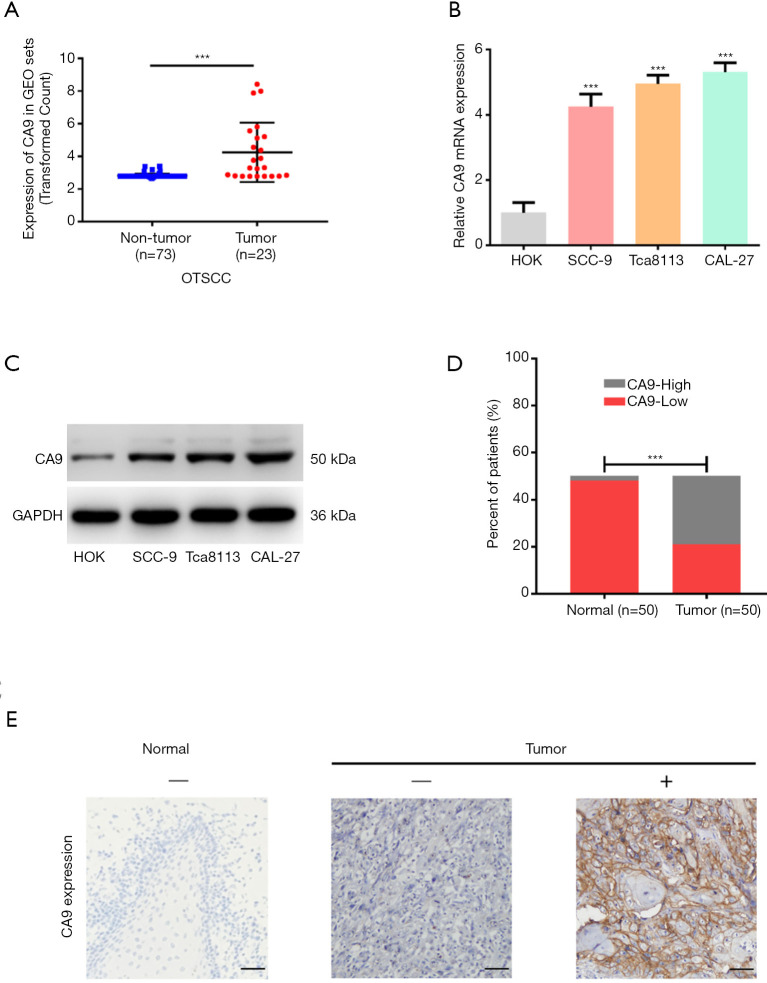
Figure 6.
Validation of CA9 expression. (A) CA9 expression from the GEO dataset. (B) Expression of CA9 in cell lines at the mRNA level. (C) Expression of CA9 in cell lines at the protein level. (D) The level of CA9 protein expression in surgical tissues by immunohistochemistry. (E) Representative images of CA9 protein expression by immunohistochemistry (EnVision two-step method). ×200 magnification. Scale bars =100 µm. ***, P value <0.001. CA9, carbonic anhydrase 9; GEO, Gene Expression Omnibus (database); OTSCC, oral tongue squamous cell carcinoma.

