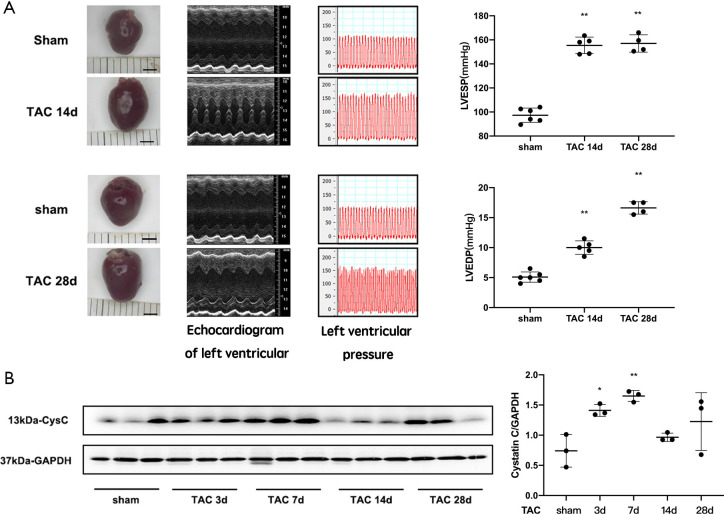
Figure 4.
Changes in CysC levels in the myocardium of TAC mice. (A) C57BL/6 wild type mouse heart echocardiogram and left ventricular pressure (LVESP and LVEDP) 14 and 28 days after TAC; (B) CysC levels in TAC mouse myocardium (*, P<0.05; **, P<0.01). TAC, transverse aortic constriction; LVEDP, left ventricular end-diastolic pressure; LVESP, left ventricular end-systolic pressure; GAPDH, glyceraldehyde-3-phosphate dehydrogenase.

