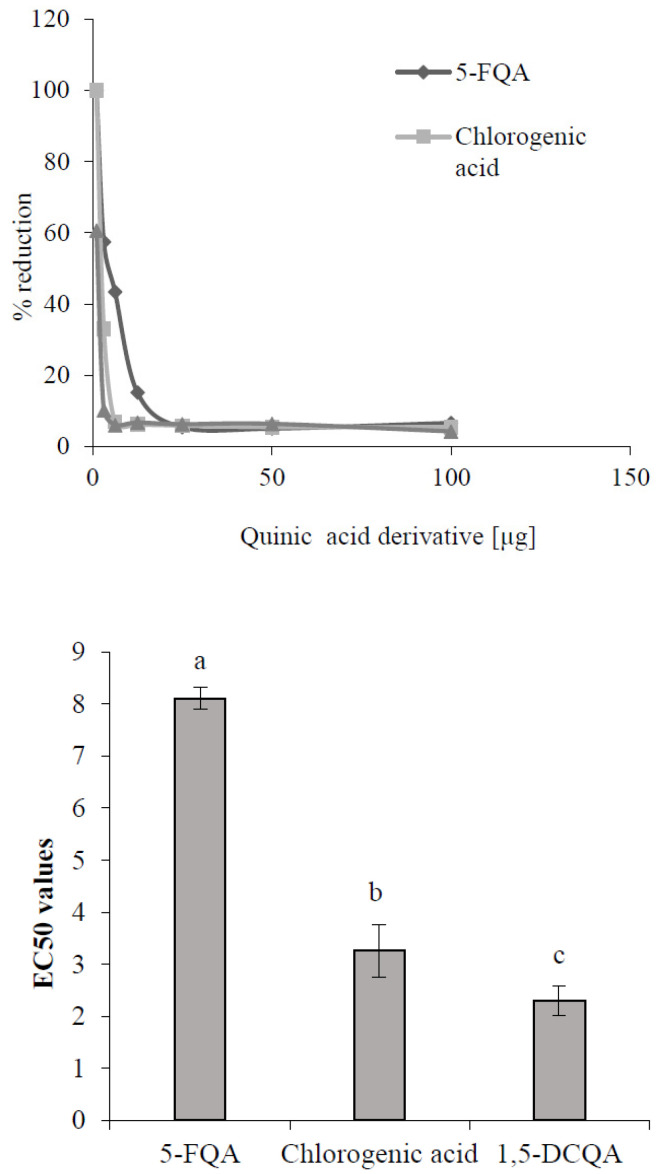
Figure 7.
Antioxidant capacity (up) and EC50 values (down) of selected quinic acid derivatives determined by the method of 2,2-diphenyl-1-picrylhydrazil (DPPH) free radical scavenging. Each value is the mean ± SD (n = 3). Different letters above columns means significant difference of values according to Tukey’s test (p < 0.05).

