Figure 6.
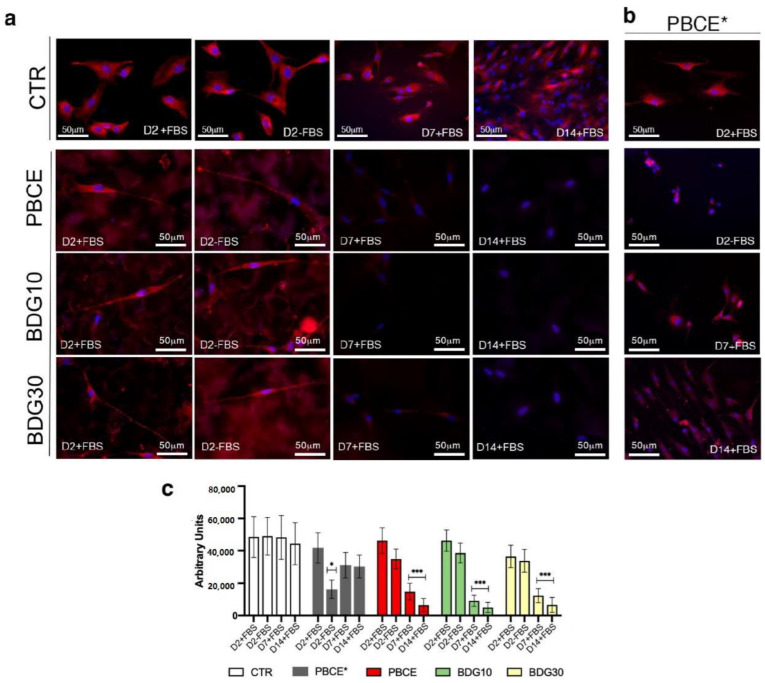
Expression of nestin in hBM-MSCs grown on PBCE*, PBCE, BDG10 and BDG30. Representative fluorescence images revealed the expression of nestin in stem cells in (a) CTR cells, PBCE-, BDG10- and BDG30-polymer cultures at D2 (in the presence (+) and absence (−) of FBS), at D7 and D14 (in the presence (+) of FBS); (b) cells on PBCE* at D2 (in the presence (+) and absence (−) of FBS), at D7 and D14 (in the presence (+) of FBS). Nuclei (DAPI, blue), and nestin (human anti-nestin antibody, red). Scale bar 50 μm. (c) quantitative analysis of nestin expression in hBM-MSCs on PBCE*, PBCE, BDG10 and BDG30 a CTR at each time point. Data are expressed as mean ± SD, * p < 0.05, *** p < 0.005. For each experiment, an average of 100 cells for each culture condition was considered.

