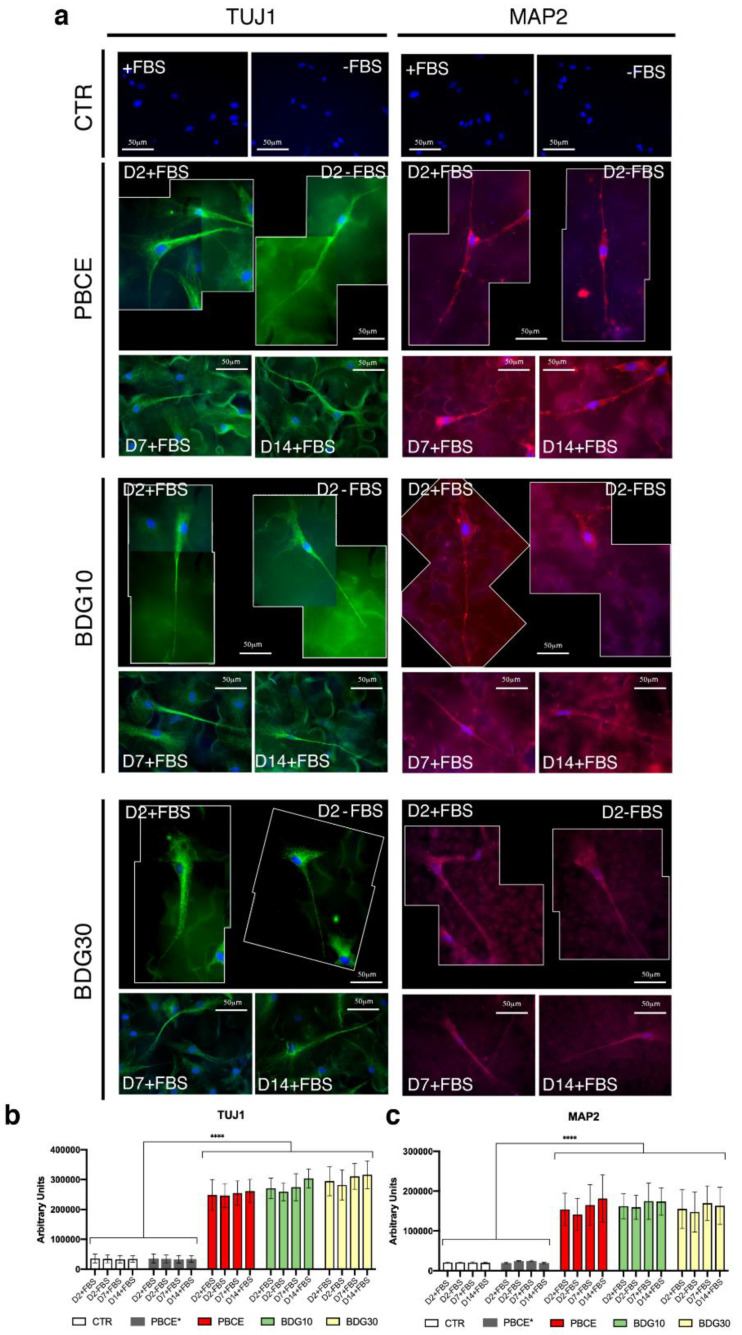
Figure 7.
Expression of TUJ1 and MAP2 in hBM-MSCs grown on PBCE, BDG10 and BDG30. (a) Representative fluorescence images of hBM-MSC nuclei (DAPI, blue), TUJ1 (human anti-TJU1 antibody, green), and MAP2 (human anti-MAP2 antibody, red), revealed the absence of TUJ1 and MAP2 in cells on CTR cultures, both in FBS presence (+) and absence (−). TUJ1 expression in stem cells on PBCE, on BDG10 and on BDG30 at different time points (D2-D14 in the presence (+) FBS and at D2 and in the absence (−) of FBS). MAP2 expression in stem cells on PBCE, on BDG10 and on BDG30 at different time points [D2-D14 in the presence (+) FBS and at D2 in the absence (−) of FBS]. Scale bar 50 μm. Due to the length of the cells, the images include two microscope frames. The CTR images are representative of all time points analyzed (D2-D14). See also Figure S7 in supporting file for visual images in gray levels. Fluorescent interference of polymer films without cells was evaluated. (b,c) Quantitative IF of the expression of TUJ1 (b) and MAP2 (c) in hBM-MSCs grown on PBCE, BDG10, BDG30, PBCE* and in control condition at each time in culture. Data are expressed as mean ± SD, **** p < 0.0001. For each experiment, an average of 100 cells for each culture condition was considered.

