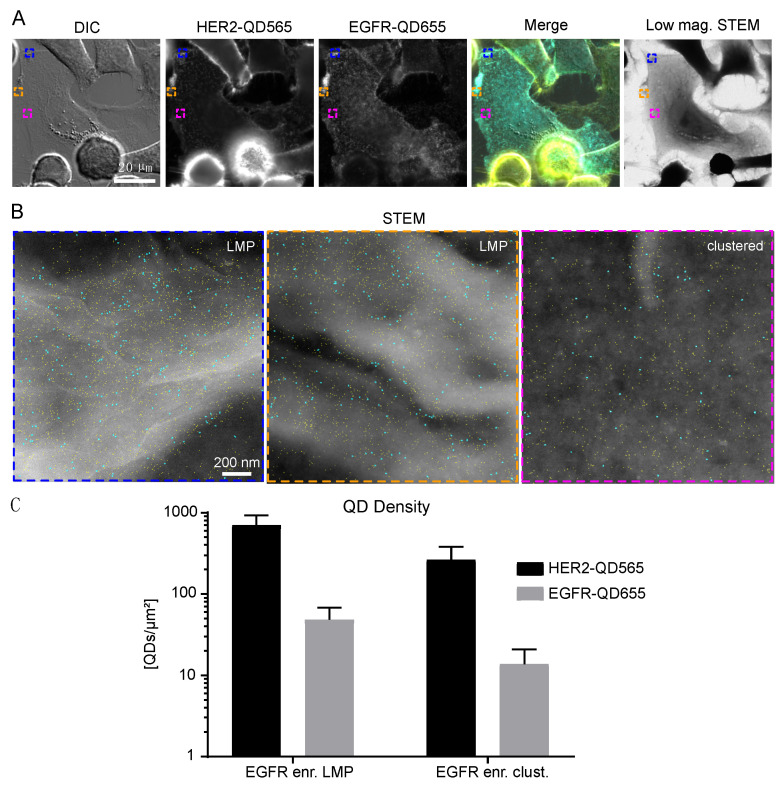
Figure 4.
HER2 and EGFR expression on SKBR3 EGFR enriched cells. (A) Correlative fluorescence and low magnification electron microscopy of SKBR3 cells labeled for HER2-QD565 and EGFR-QD655. Light microscope images were taken with a 63× oil objective. The same region is shown for the low magnification brightfield STEM image, M = 800×. Colored rectangles depicted in (A) indicate the magnified areas shown in (B) acquired with annular dark field STEM at M = 120,000×. Individual QDs are visible and outlined in cyan (EGFR labeled with streptQD655) and yellow (HER2 labeled with streptQD565). (C) Mean QD densities for HER2 and EGFR for all analyzed EGFR enriched regions (large membrane protrusions and clustered) with standard deviation indicated. Colors in the merged image in (A): yellow for HER2 and cyan for EGFR. Scale bars: 20 µm (A) and 200 nm (B).

