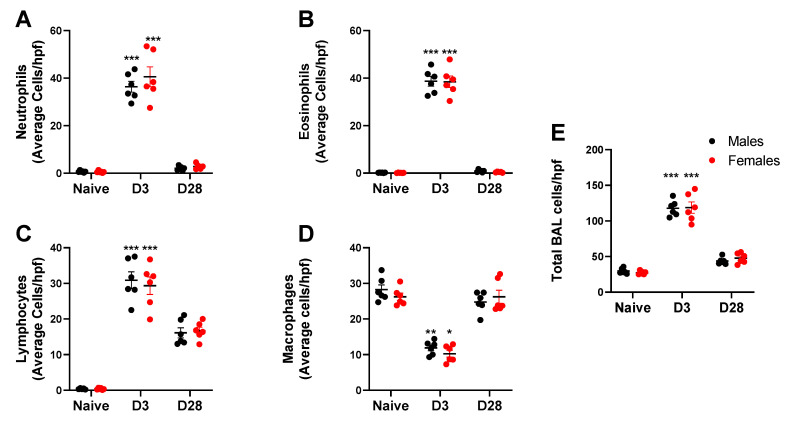
Figure 4.
Leukocyte counts (mean ± SEM) observed in the bronchoalveolar lavage (BAL) wash obtained from male and female mice at days 0 (naïve), 3 or 28 post third A. fumigatus challenge. *, **, ***; p-value ≤ 0.05, 0.01 and 0.001, respectively, indicate a comparison of mean ± SEM values between day 0 (naïve) and A. fumigatus challenged mice. Average cells per high power field (hpf) are represented in (A) Neutrophils; (B) Eosinophils; (C) Lymphocytes; (D) Macrophages; (E) Total BAL cells

