Figure 3.
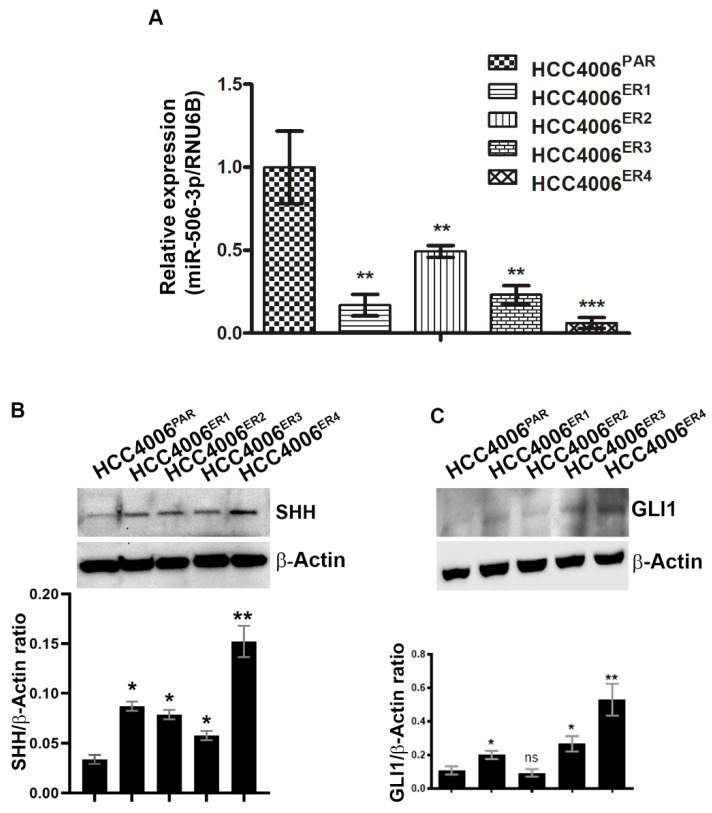
Downregulation of miR-506-3p and upregulation of its target Sonic Hedgehog (SHH) and glioma-associated oncogene homolog zinc finger protein 1 (GLI1) expression. (A) The bar graph indicates the quantitative relative expression of miR-506-3p in erlotinib-sensitive cells (HCC4006PAR) and erlotinib-resistant cells (HCC4006ER1, ER3 and ER4) by real-time PCR. Data are expressed as the mean ± SD, ** p < 0.005, *** p < 0.001 when compared to HCC4006PAR. (B) Western blot analysis and quantification (bar graph) of SHH protein erlotinib sensitive and resistant cells. β-actin is used as a loading control. Data show the mean ± SD and are representative of at least three independent experiments. * p < 0.01, ** p < 0.003 when compared to HCC4006PAR. (C) Detection and quantification (bar graph) of GLI1 protein level in sensitive and resistant cells using Western blot analysis. β-actin is used as a loading control. Data are expressed as the mean ± SD ns, non-significant and * p < 0.01, ** p < 0.007 when compared to HCC4006PAR.

