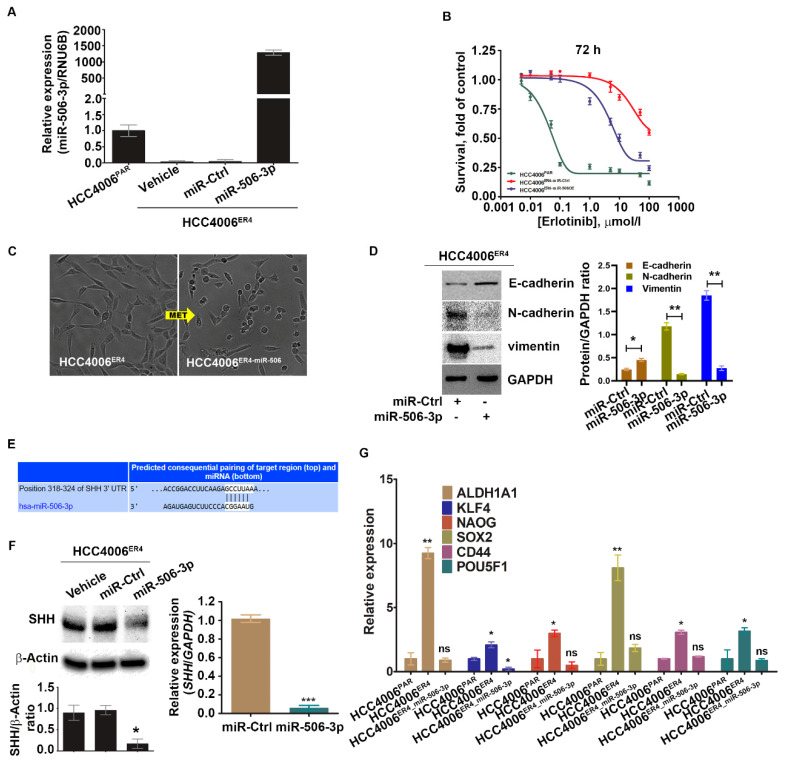
Figure 4.
Ectopic expression of miR-506-3p increases erlotinib sensitivity by reversing EMT and downregulating SHH and other stem cell markers. (A) Real-time PCR analysis of miR-506-3p after transfection with miR-506-3p vectors into HCC4006ER4 cells. The expression of miR-506-3p was normalized to the expression in HCC4006PAR cells. Data are expressed as the mean ± SD, * p < 0.005, ** p < 0.0002 when compared to HCC4006PAR. (B) The survival curves of HCC4006PAR, miR-control erlotinib-resistant cells (HCC4006ER4-miR-Ctrl), and miR-506-3p overexpressed resistant cells (HCC4006miR-506-3pOE) in the presence of different concentrations of erlotinib. (C) The photomicrographs represent the morphological changes (from mesenchymal-epithelial transition, MET) in HCC4006ER4 and HCC4006miR-506-3pOE cells (Magnification, 10×). (D) Western blot analyses of EMT markers in HCC4006ER4 cells transfected with miR-Ctrl and miR-506-3p vectors. The right panel shows the SDi-quantitative estimation by densitometry analysis of protein bands. For semi-quantitative analysis, E-cadherins, N-cadherins, and vimentin bands are evaluated upon normalization with the corresponding housekeeping GAPDH protein band. * p < 0.005, ** p < 0.0035 when compared with HCC4006ER4-miR-Ctrl cells. (E) Seed matched sequences for miR-506-3p in the coding region of SHH mRNA were identified by TargetScan 7.2. The sequences in white are the locations of the potential seed-matched sequences for the 3’UTR SHH and miR-506-3p. (F) Reduced expression of SHH in HCC4006miR-506-3pOE cells compared to erlotinib-resistant cells (ER4-vehicle and ER4-miR-control). The bar graph shows the relative protein expression; β-actin was used as a loading control. Right panel indicates the quantitative relative expression of SHH mRNA in resistant cell lines transfected with miR-Ctrl and miR-506-3p vectors by real-time PCR. Data are presented as the mean ± SD for three independent experiments. Data are expressed as the mean ± SD * p < 0.001, *** p < 0.0001. (G) Real-time PCR analysis of stemness markers in HCC4006PAR, HCC4006ER4, and HCC4006miR-506-3pOE cells. ns, non-significant; * p < 0.01, ** p < 0.001 vs. HCC4006PAR.

