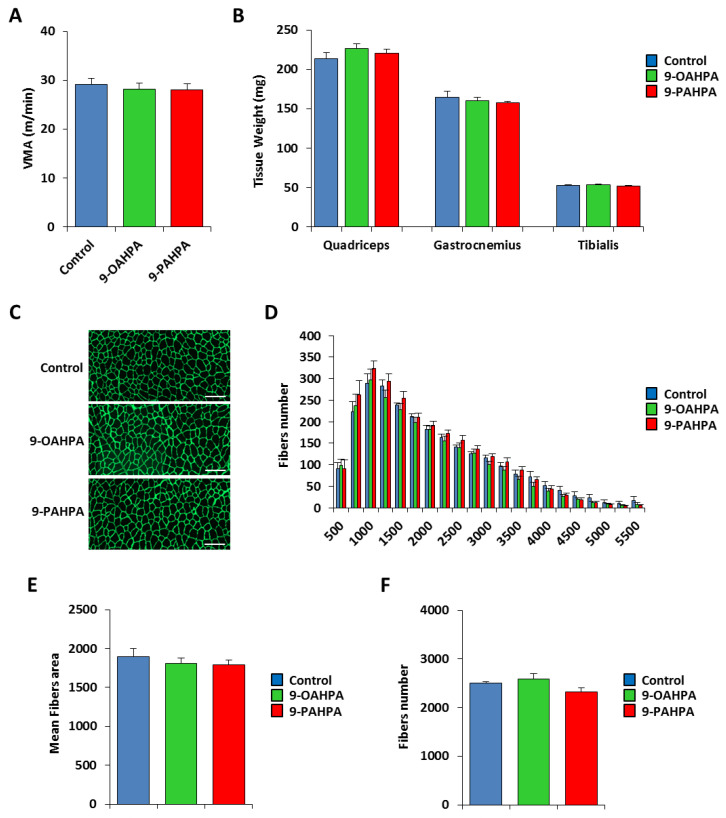
Figure 6.
Influence of long-term intake of 9-OAHPA and 9-PAHPA on skeletal muscle phenotype of C57BL/6J mice. (A) Maximal aerobic speed (n = 10 for each group). (B) Quadriceps, gastrocnemius, and tibialis muscles weight (n = 10 for each group). (C) Representative anti-laminin staining on cryosections of tibialis muscles. Scale bar, 200 μm. (D) Fiber size distribution in tibialis muscles (n = 10 for each group). (E) Mean fibers area (n = 10 for each group). (F) Total fibers number (n = 10 for each group). There is no statistical difference (Student’s t-test). Results are expressed as means ± SEM.

