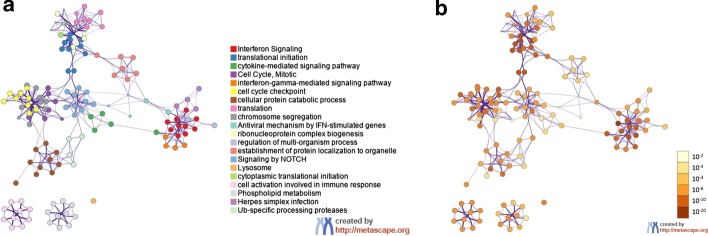
Fig. 2.
Metascape functional analysis of transcriptional differences in circulating leukocytes from COVID19 + and COVID19− critically ill patients. The list of 1311 differentially expressed genes was submitted to Metascape using express analysis of Homo sapiens gene IDs. A subset of enriched terms was selected and rendered as a network plot, where terms with a similarity > 0.3 were connected by edges. The network was visualized using Metascape. Each node represents an enriched term and coloured first by its cluster ID (a) and then by its p-value (b)

