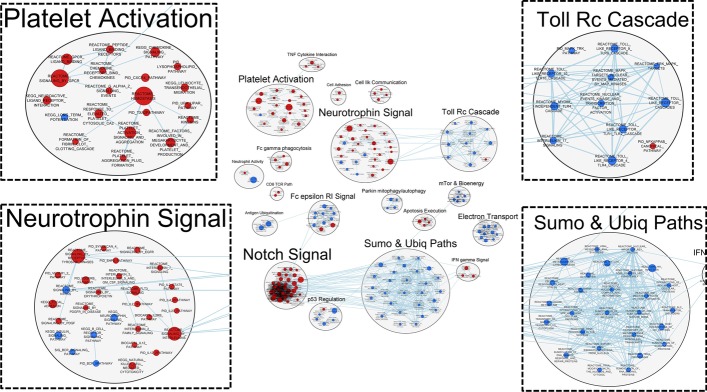
Fig. 5.
Correlation network generated from transcriptional differences in circulating leukocytes derived from COVID19 + and COVID19− critically ill patients. Each node represents a unique gene set and the edges represent the coefficient of similarity between gene sets above a defined threshold. Markov Cluster Algorithm (MCL) clustering analyses revealed groups of gene transcript nodes, where platelet activation, neurotrophin signalling, toll-like receptor signalling cascades, and sumoylation/ubiquitination pathways were identified as the top four nodes. Red indicates positive enrichment of gene transcripts and blue indicates negative enrichment of gene transcripts.

