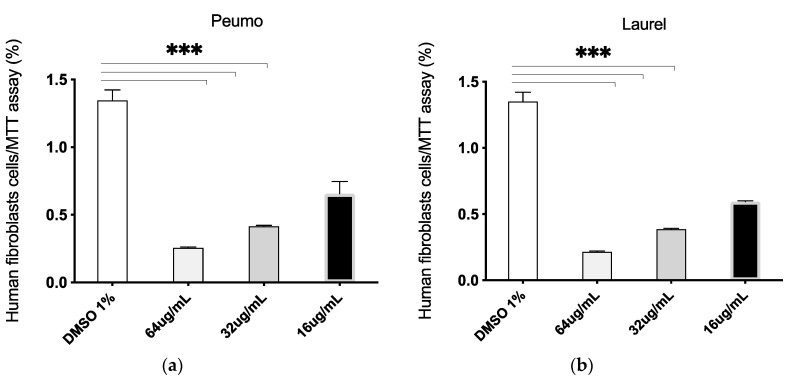
Figure 5.
Dose-response curve of human fibroblasts cells treated with Cryptocarya alba (Peumo; CA); Laurelia sempervirens (Laurel; LS) EOs. The graph bar corresponds to the proliferation of fibroblasts cells treated with the Eos (a. Peumo) and (b. Laurel), at different concentrations versus control (DMSO 1%) for 48 h, evaluated by MTT assay at 570 nm. Three independent trials were performed, in triplicate, for each treatment and concentration. *** p < 0.001.

