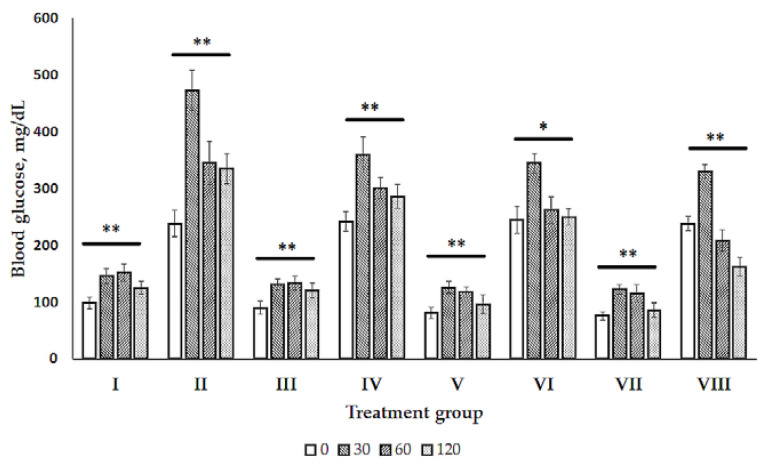
Figure 1.
Glucose tolerance test (GTT) of normal (healthy) and diabetic rats. The data shown are of the group I—normal control, group II—diabetic control, group III—normal control administrated by 512 mg/kg olive leaf extract (OLE), group IV—diabetic control administrated by 512 mg/kg olive leaf extract (OLE), group V—normal control administrated by 768 mg/kg olive leaf extract (OLE), group VI—diabetic control administrated by 768 mg/kg olive leaf extract (OLE), group VII—normal control administrated by 1024 mg/kg olive leaf extract (OLE), group VIII—diabetic control administrated by 1024 mg/kg olive leaf extract (OLE). Blood glucose level was monitored at the start (0 min) and 30, 60, and 120 min after the OLE administration. Differences between the normal and diabetic rats at the time 0, 30, 60, and 120 min of treatment were determined by nonparametric Kruskal–Wallis analysis of variance (ANOVA) by Ranks test. The difference was significant at * p < 0.05 and ** p < 0.01.

