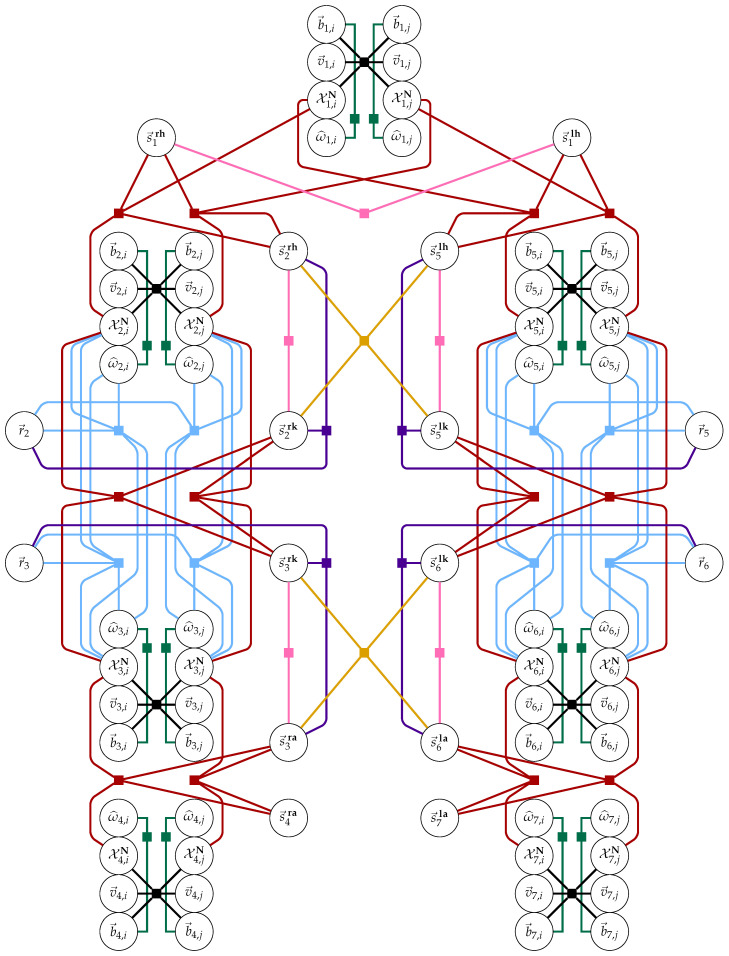
Figure 3.
Factor graph representation of the problem for consecutive keyframes i and j. Variables are represented as circles, whereas the connecting factors are represented as solid squares. For readability, factors and their connecting lines to variables are colored according to factor type: black is the IMU dynamics factor, teal is the angular velocity model, pink is anthropometry, blue is knee hinge kinematics, red is the constrained joint center between IMUs model, violet is the knee axis to segment length quasi-orthogonality factor, and orange is the segment length discrepancy factor. All variable notation is defined in Section 2.1.

