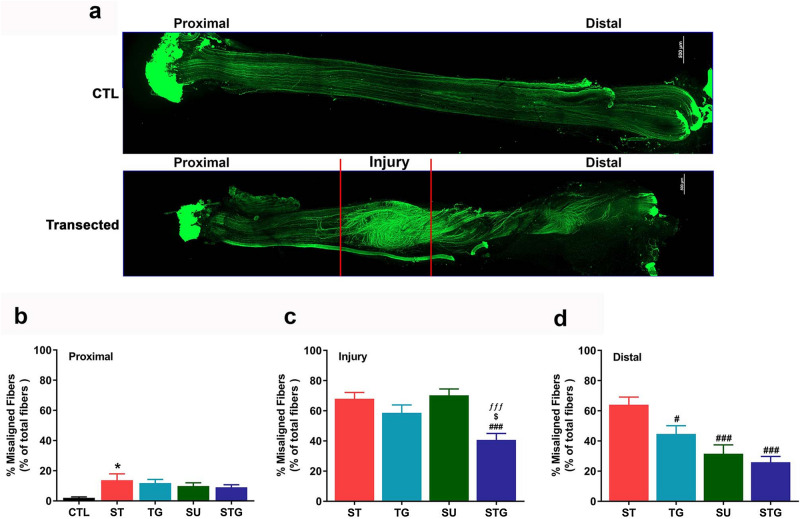
Figure 2.
(a) Representative images from an uninjured and a transected nerve to show the orientation of neurofilaments at different zones. Scale bar, 500 µm (at upper right corner). Bar graph showing the quantification of misaligned fibers at proximal (b), injury (c) and distal (d) zones of transected nerves. Misaligned fibers are shown as the percentage of total number of fibers in each zone. n = 3/group, *P < 0.05, ***P < 0.001 vs. uninjured (CTL), #P < 0.05, ###P < 0.001 vs. ST, $P < 0.05 vs. TG, and ƒƒƒP < 0.001 vs. SU. For other details, see Fig. 8.

