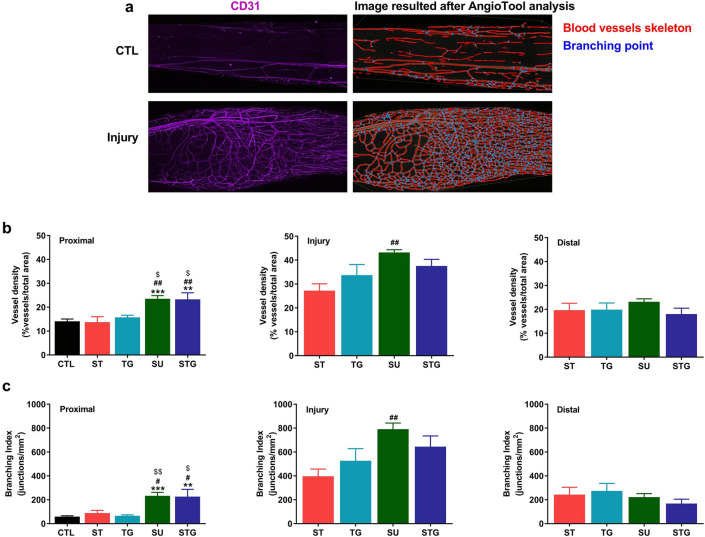
Figure 4.
(a) Representative images from an uninjured and a transected nerve to show the blood vessels (left) and AngioTool reconstruction result (right) images. AngioTool images clearly depict the blood vessel architecture as red lines and their branching points as blue dots. Bar graph showing the quantification of blood vessels at proximal, injury, and distal zones of transected nerves. (b) Blood vessel density is shown as the percentage of number of blood vessel in total area. (c) Branching index of blood vessels is shown as the number of blood vessel junctions/mm2. n = 3/group, **P < 0.01, ***P < 0.001 vs. uninjured (CTL), #P < 0.05, ##P < 0.01 vs. ST, and $$P < 0.05 vs. TG. For other details, see Fig. 8.

