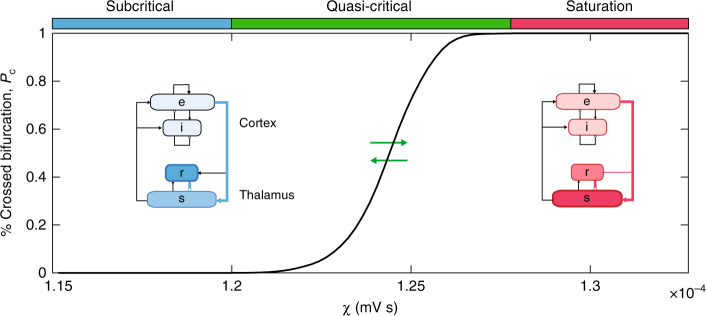
Fig. 2. Promoting quasi-critical states.
The time averaged percentage of nodes that have crossed their bifurcation, Pc, as a function of diffuse coupling, χ. We identified three qualitative zones: a low variability subcritical zone (blue), where no nodes crossed their bifurcation point for the full duration of the simulation, a highly variable, quasi-critical zone (green) where at least one node was below its bifurcation during the second half of the simulation, and a saturated, oscillatory zone (red). The insets show steady-state firing rates for each population within the neural mass model relatively represented via color intensity.

