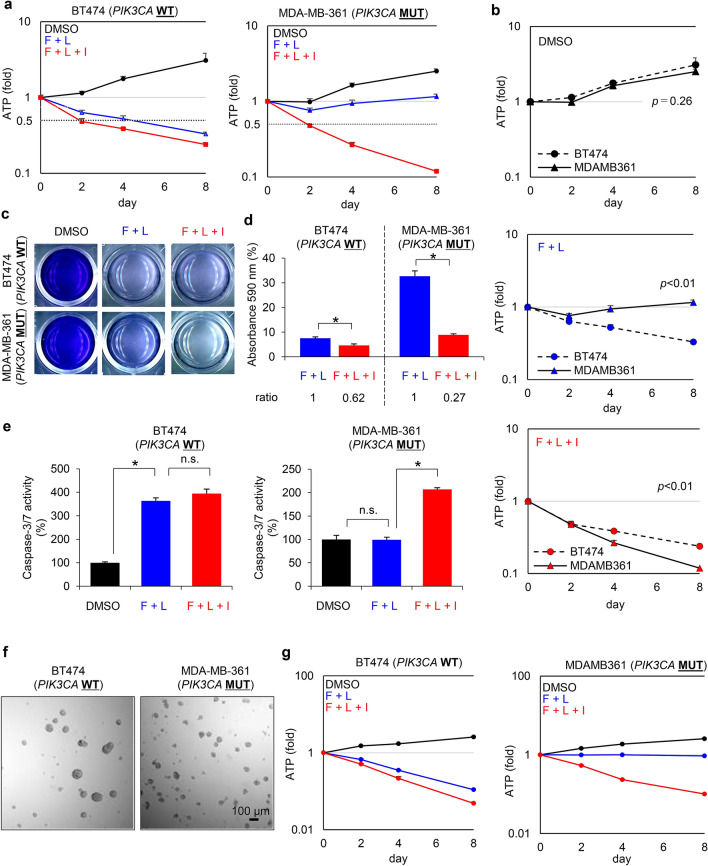
Figure 4.
Ipatasertib enhances the antiproliferative activity of fulvestrant and lapatinib combination in a PIK3CA-mutant HER2+/ER+ breast cancer cell line. (a) Antiproliferative activity of BT474 (PIK3CA-wild-type, left) and MDA-MB-361 (PIK3CA-mutant, right) cells treated with DMSO (black), combination of fulvestrant (100 nM) and lapatinib (100 nM) (blue), and the triple-combination of fulvestrant, lapatinib, and ipatasertib (1000 nM) (red) for 0, 2, 4, and 8 days (mean ± SD [n = 3]). Relative ATP amounts were compared with the chemiluminescence value of DMSO treatment on day 0. (b) Comparison of the inhibitory effect in each drug treatment between BT474 and MDA-MB-361 cell lines. Differences on day8 were analyzed using Student’s t-test. The data represent the mean ± SD (n = 3). (c) Representative images of crystal violet staining in BT474 or MDA-MB-361 cells treated with DMSO, the combination of fulvestrant (100 nM) and lapatinib (100 nM), and the triple-combination of fulvestrant, lapatinib, and ipatasertib (1000 nM) for 8 days. (d) Quantified data from Fig. 4c. Crystal violet absorbance indicating the amount of normalized protein was measured with a microplate reader and compared with a DMSO control. The data represent mean ± SD (n = 3). Crystal violet absorbance was statistically analyzed using Student’s t-test to compare the double-combination and the triple-combination treatments. Differences were considered significant at p ≤ 0.05 (*). (e) Effect of combined fulvestrant, lapatinib, and ipatasertib treatment on the apoptosis of BT474 (left) and MDA-MB-361 (right) cells. The cells were treated with DMSO (black), the combination of fulvestrant (100 nM) and lapatinib (100 nM) (blue), and the triple-combination of fulvestrant, lapatinib, and ipatasertib (1000 nM) (red) for 24 h (mean ± SD [n = 3]). Relative caspase-3/7 activities were calculated based on luminescence compared with the DMSO control. Caspase-3/7 activities were analyzed using Student’s t-test to compare the DMSO treatment and the double-combination treatment, and the double-combination and the triple-combination treatments. Differences were considered significant at p ≤ 0.05 (*). F, Fulvestrant; L, Lapatinib; I, Ipatasertib; n.s., not significant. (f) Representative images of 3D culture in BT474 (left) or MDA-MB-361 (right) cells. (g) Antiproliferative activity of 3D-cultured BT474 (PIK3CA-wild-type, left) and MDA-MB-361 (PIK3CA-mutant, right) cells treated with DMSO (black), combination of fulvestrant (100 nM) and lapatinib (100 nM) (blue), and the triple-combination of fulvestrant, lapatinib, and ipatasertib (1000 nM) (red) for 0, 2, 4, and 8 days (mean ± SD [n = 3]). Relative ATP amounts were compared with the chemiluminescence value of DMSO treatment on day 0.

