Figure 5.
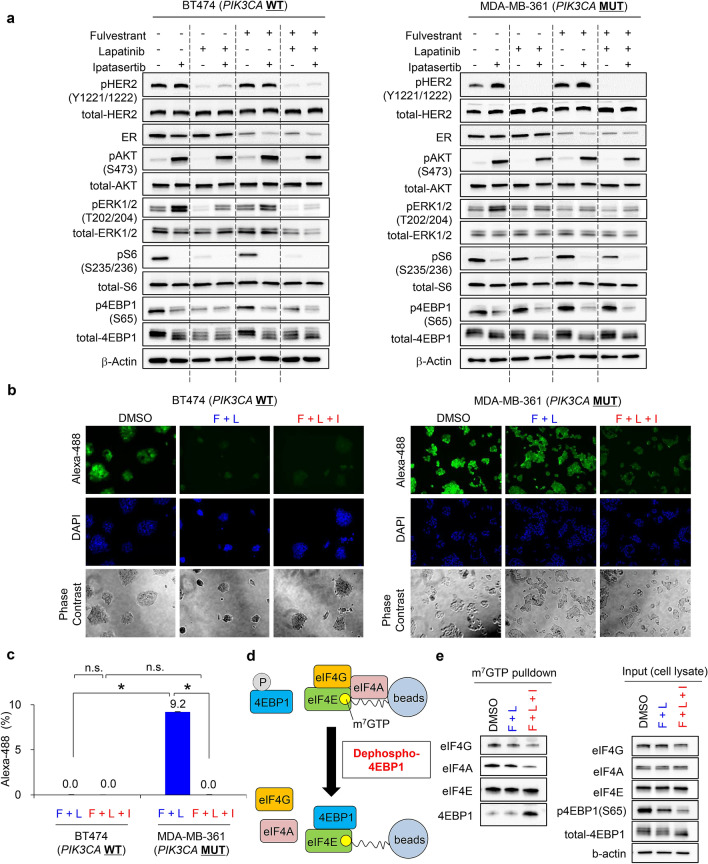
Ipatasertib potently suppresses 4EBP1 phosphorylation in MDA-MB-361 cells treated with combined fulvestrant and lapatinib, inhibiting newly-synthesized proteins. (a) Inhibitory effects of ipatasertib on 4EBP1 phosphorylation in fulvestrant and lapatinib-treated BT474 (left) and MDA-MB-361 (right) cells. The cells were treated with fulvestrant (100 nM), lapatinib (100 nM), ipatasertib (1000 nM), and their combinations for 24 h. Plus (+) and minus (−) indicate the presence or absence of treatment. Phosphorylated HER2, ER, and AKT were used as pharmacodynamic markers to confirm target engagement of lapatinib, fulvestrant, and ipatasertib, respectively. β-actin was used as a loading control. Full-length blots are presented in Supplementary Figs. 8 and 9. (b) Newly synthesized protein in cells treated with DMSO, combination treatment with fulvestrant and lapatinib, and triple-combination treatment with fulvestrant, lapatinib, and ipatasertib. BT474 (left) and MDA-MB-361 (right) cells were treated with the indicated inhibitors for 24 h, and then Click-iT HPG was incorporated into drug-treated cells for 15 h. Green indicates the newly synthesized proteins detected by the Click-iT assay (Life Technologies) and DAPI-stained nuclei, respectively. (c) Quantified data from Fig. 5b. The fluorescent images were captured by BZ-X800 (Keyence Corporation), and the captured images were quantified by a BZ-X800 Analyzer (Keyence Corporation). Alexa-488 fluorescence was normalized using DAPI fluorescence. The y axis indicates the relative Alexa-488 fluorescence, calculated based on fluorescence compared with the DMSO-treatment control. The data represent the mean ± SD (n = 3). The relative Alexa-488 fluorescence was statistically analyzed using Student’s t-test to compare the double-combination and the triple-combination. Differences were considered significant at p ≤ 0.05 (*). F, Fulvestrant; L, Lapatinib; I, Ipatasertib; n.s., not significant. (d) Experimental schemes of cap-pulldown assay. (e) Cap pulldown assay in MDA-MB-361 cells in the triple combination. The cells were treated with fulvestrant (100 nM), lapatinib (100 nM), ipatasertib (1000 nM), and their combinations for 24 h. Immunoblotting of eIF4G, eIF4A, eIF4E, and 4EBP1 were performed in the m7 GTP pulldown samples. eIF4E was used as a pulldown positive control. Immunoblotting of eIF4G, eIF4A, eIF4E, p4EBP1, and 4EBP1 in cell lysates was performed as input controls. β-actin was used as a loading control. Full-length blots are presented in Supplementary Fig. 10.

