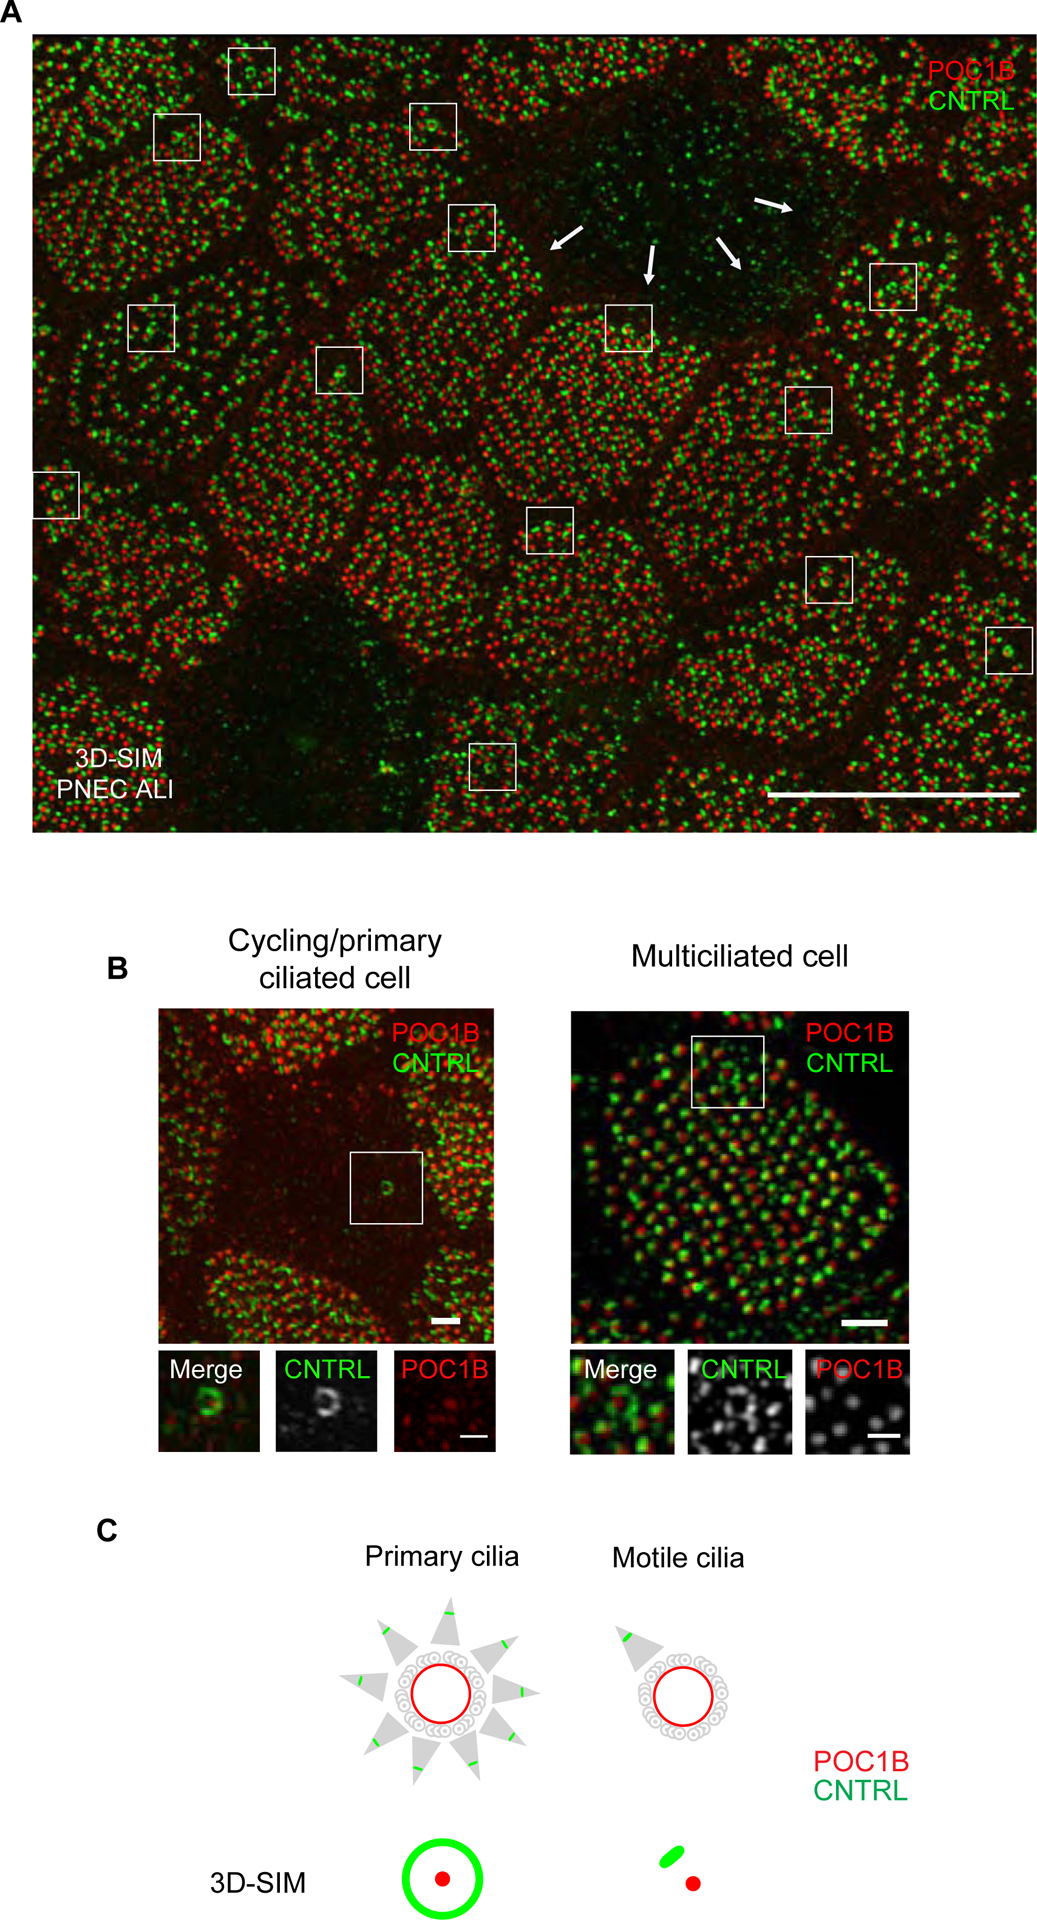
Figure 1. Super-resolution reveals a basal body with multiple basal feet in airway multiciliated cells.

(A) 3D-SIM volume maximum intensity projection of large field of view of nasal primary airway multiciliated cell (PNEC) grown in air liquid interphase labeled with anti-CNTRL (green) and anti-POC1B (red) antibodies. Note the ring-like pattern of CNTRL localization encircling the basal body labeled by POC1B (boxed areas). Scale bar represents 10 μm. ALI, air liquid interface. (B) 3D-SIM volume maximum intensity projection of an airway cycling/primary ciliated cell (left) or nasal airway multiciliated cell (right) grown in ALI labeled with anti-CNTRL (green) and anti-POC1B (red) antibodies. Scale bars represent 1 μm and 500 nm (boxed areas). (C) Cartoon representation of basal body-basal foot structure by TEM in cells with primary or motile cilia (upper panel) and by 2 colour 3D-SIM imaging of basal body and basal foot (lower panel). By 3D-SIM microscopy the basal body protein POC1B appears as a dot while the basal foot protein CNTRL appears as a dot in motile cilia, but as a ring in primary cilia. Red represents localization of POC1B and green represents localization of CNTRL. See also Figure S1.
