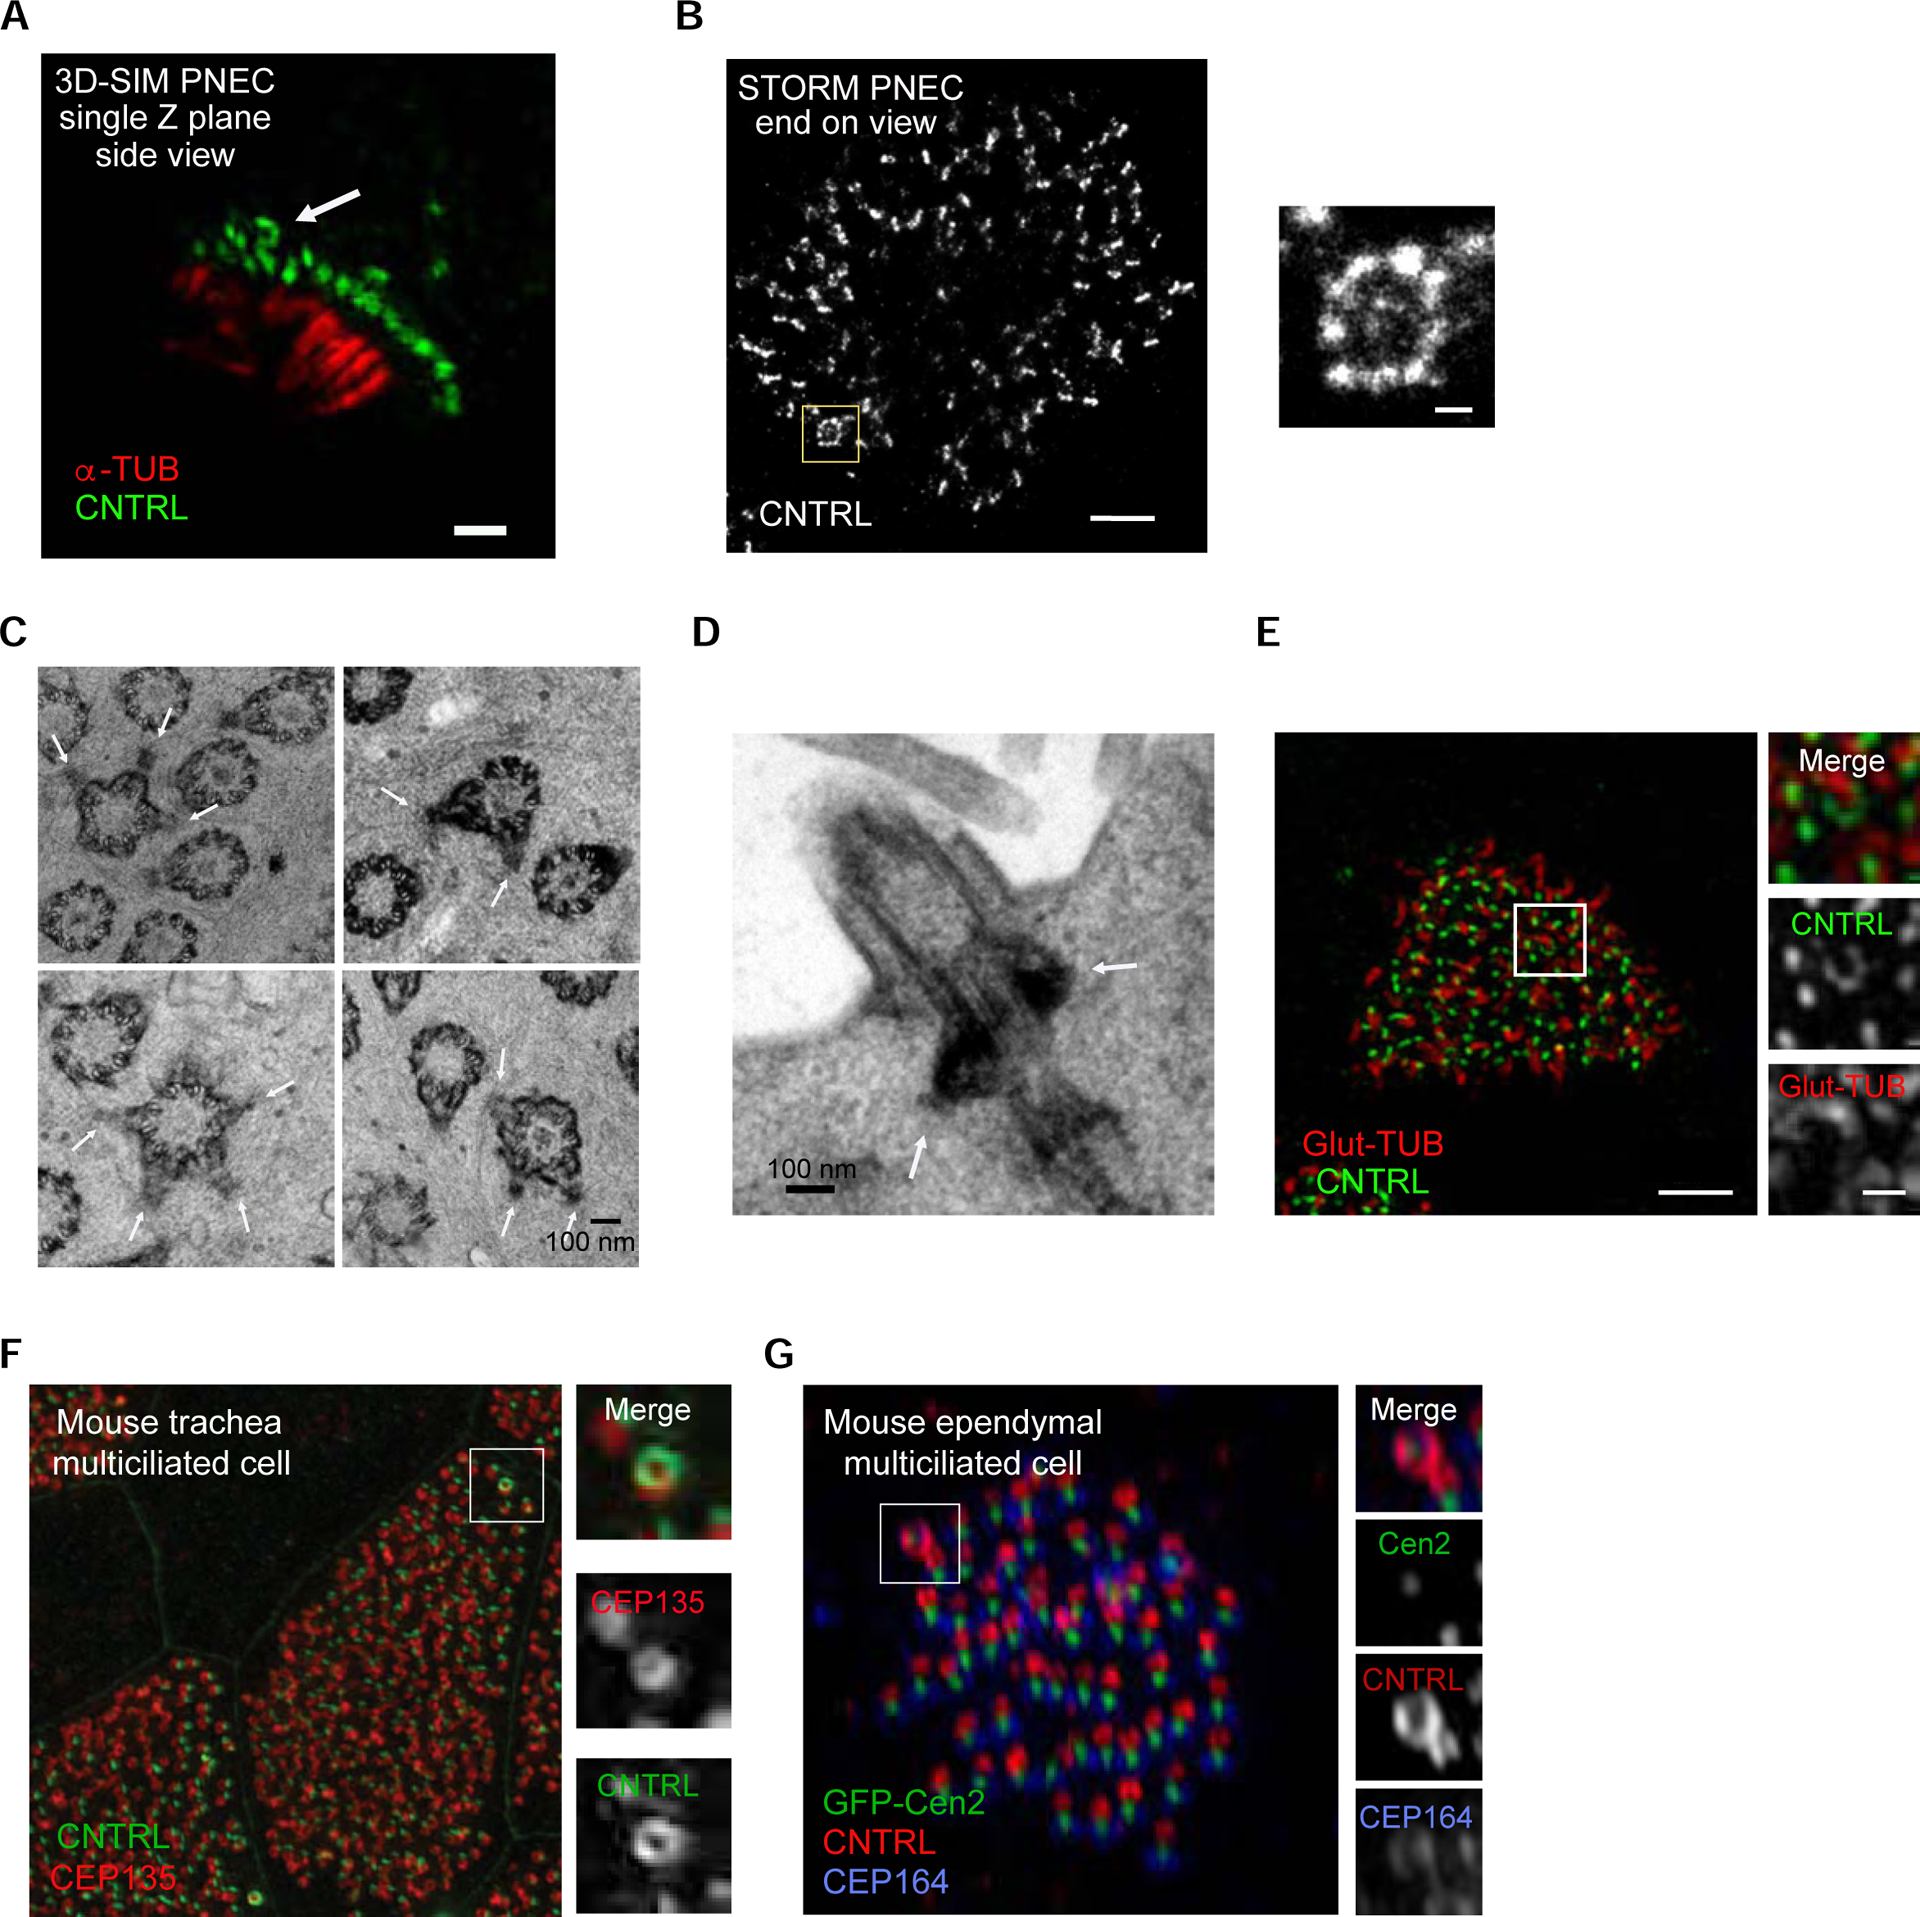
Figure 2. The basal body extrudes a cilium and is conserved in different mammalian primary cells, tissues and species.

(A) 3D-SIM single-plane image of a human nasal airway multiciliated cell freshly isolated from a healthy individual, labeled with anti-CNTRL (green) and anti-alpha-tubulin (red) antibodies, showing the presence of the basal body with multiple basal feet. Scale bar represents 1 μm. (B) Left: STORM micrograph of airway multiciliated cell labeled with anti-CNTRL antibody, showing a distinct ring-like distribution of CNTRL (boxed area). Right: High-magnification view of boxed area. Scale bars represent 1 μm (left) and 100 nm (right). (C) Collage of representative TEM micrographs showing basal bodies harbouring multiple basal feet in ALI-cultured human airway multiciliated cells (see white arrows). Scale bar represents 100 nm. (D) TEM micrograph showing axoneme emanating from basal bodies harbouring multiple basal feet (in white arrows) in human airway multiciliated cell. Scale bar represents 1 μm. (E) Left: 3DSIM volume maximum intensity projection of an ALI-cultured human airway multiciliated cell labeled with anti-CNTRL (green) and anti-Glut-TUB (red) antibodies. Note the axoneme emanating from ring-like structure labeled with CNTRL (boxed area). Right: High-magnification view of boxed area with individual channels. Scale bars represent 2 μm (left) and 500 nm (right). (F) 3D-SIM volume maximum intensity projection of mouse tracheal multiciliated cell (ALI D20), labeled with anti-CNTRL (green) and anti-CEP135 (red) antibodies. Right: High-magnification view of boxed area with individual channels. Scale bar represents 2 μm. (G) 3D-SIM volume maximum intensity projection of adult mouse ependymal multiciliated cells (P16), labeled with GFP-Centrin2 (basal body), anti-CNTRL (red) and anti-CEP164 (blue, distal appendage protein) antibodies. Right: High-magnification view of boxed area labeled in left. Scale bar represents 1 μm and 200 nm.
