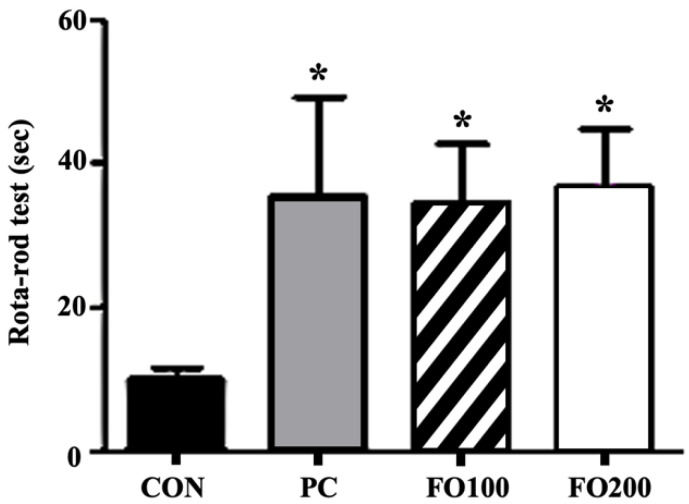
Figure 8.
Exercise endurance was measured as the total time sustained on the gyratory rod. Differences in total time were recorded following administration of 100 and 200 μg/mL of FO. Each bar represents the mean ± SD. A one-way ANOVA test was carried out to determine significant differences (* p < 0.05 vs. Control).

