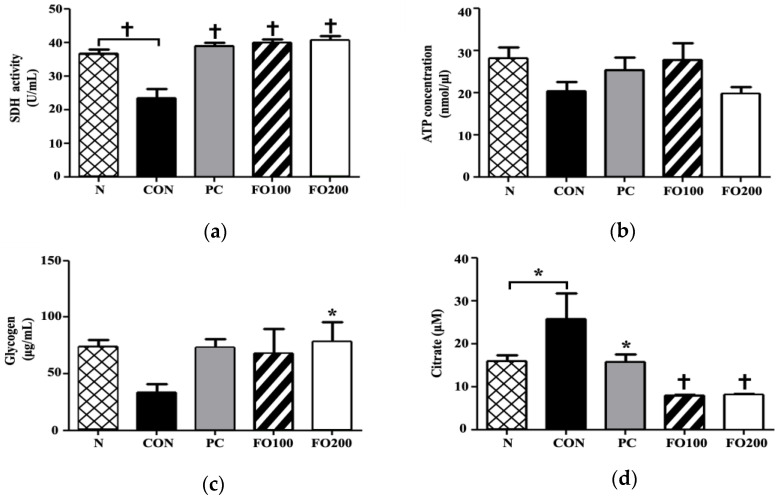
Figure 9.
Changes in muscle (a) SDH, (b) ATP, (c) glycogen and (d) citrate were measured following administration of 100 and 200 μg/mL of FO. Each bar represents the mean ± SD. A one-way ANOVA test was carried out to determine significant differences (* p < 0.05 vs. Control, † p < 0.001 vs. Control).

