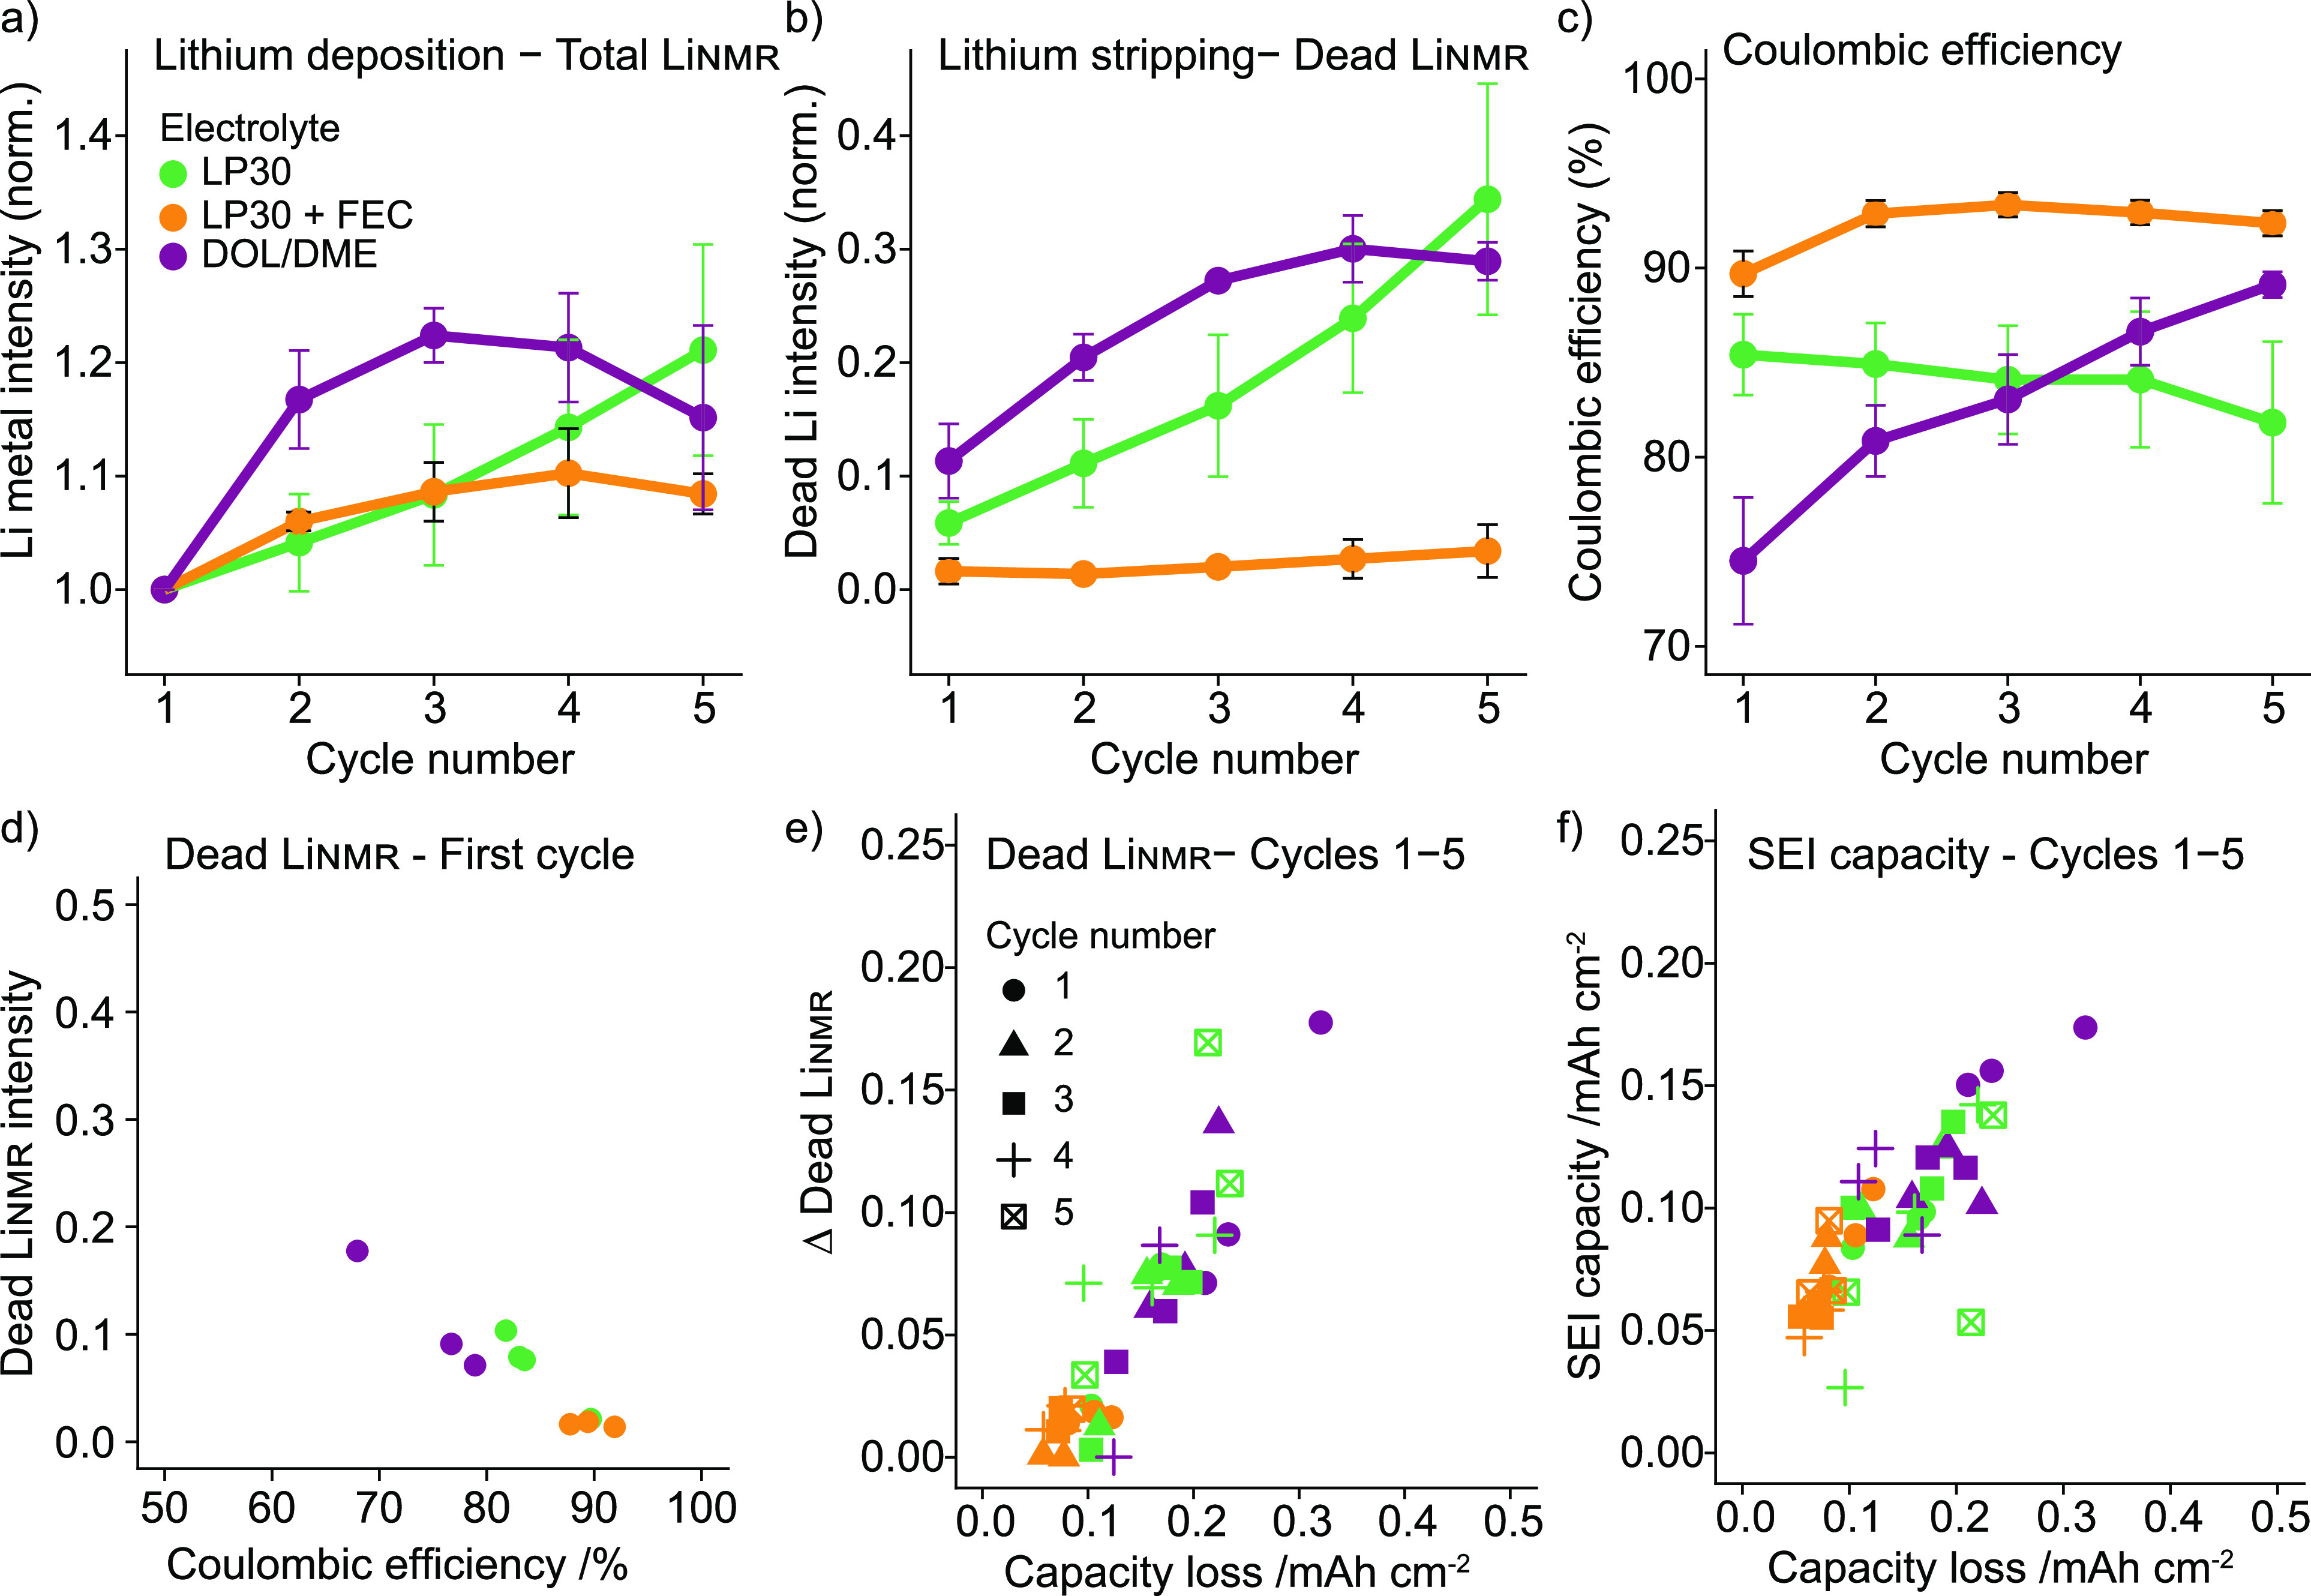
Figure 3.

Average value of the (a) normalized total LiNMR intensity at the end of plating, (b) normalized dead LiNMR intensity at the end of stripping, and (c) electrochemically obtained CE for the first five cycles in the three electrolytes, LP30 (green), LP30 + FEC (orange), and DOL/DME (purple). The error bars represent the standard deviation of the average values obtained in three different experiments. (d) The dead LiNMR measured in the first cycle plotted against the CE showing three separate experiments for each electrolyte. (e) The difference in dead LiNMR between subsequent cycles plotted against the capacity loss (mAh/cm2) calculated from the CE. (f) The SEI capacity (mAh/cm2) calculated in each cycle against the corresponding capacity loss (mAh/cm2).
