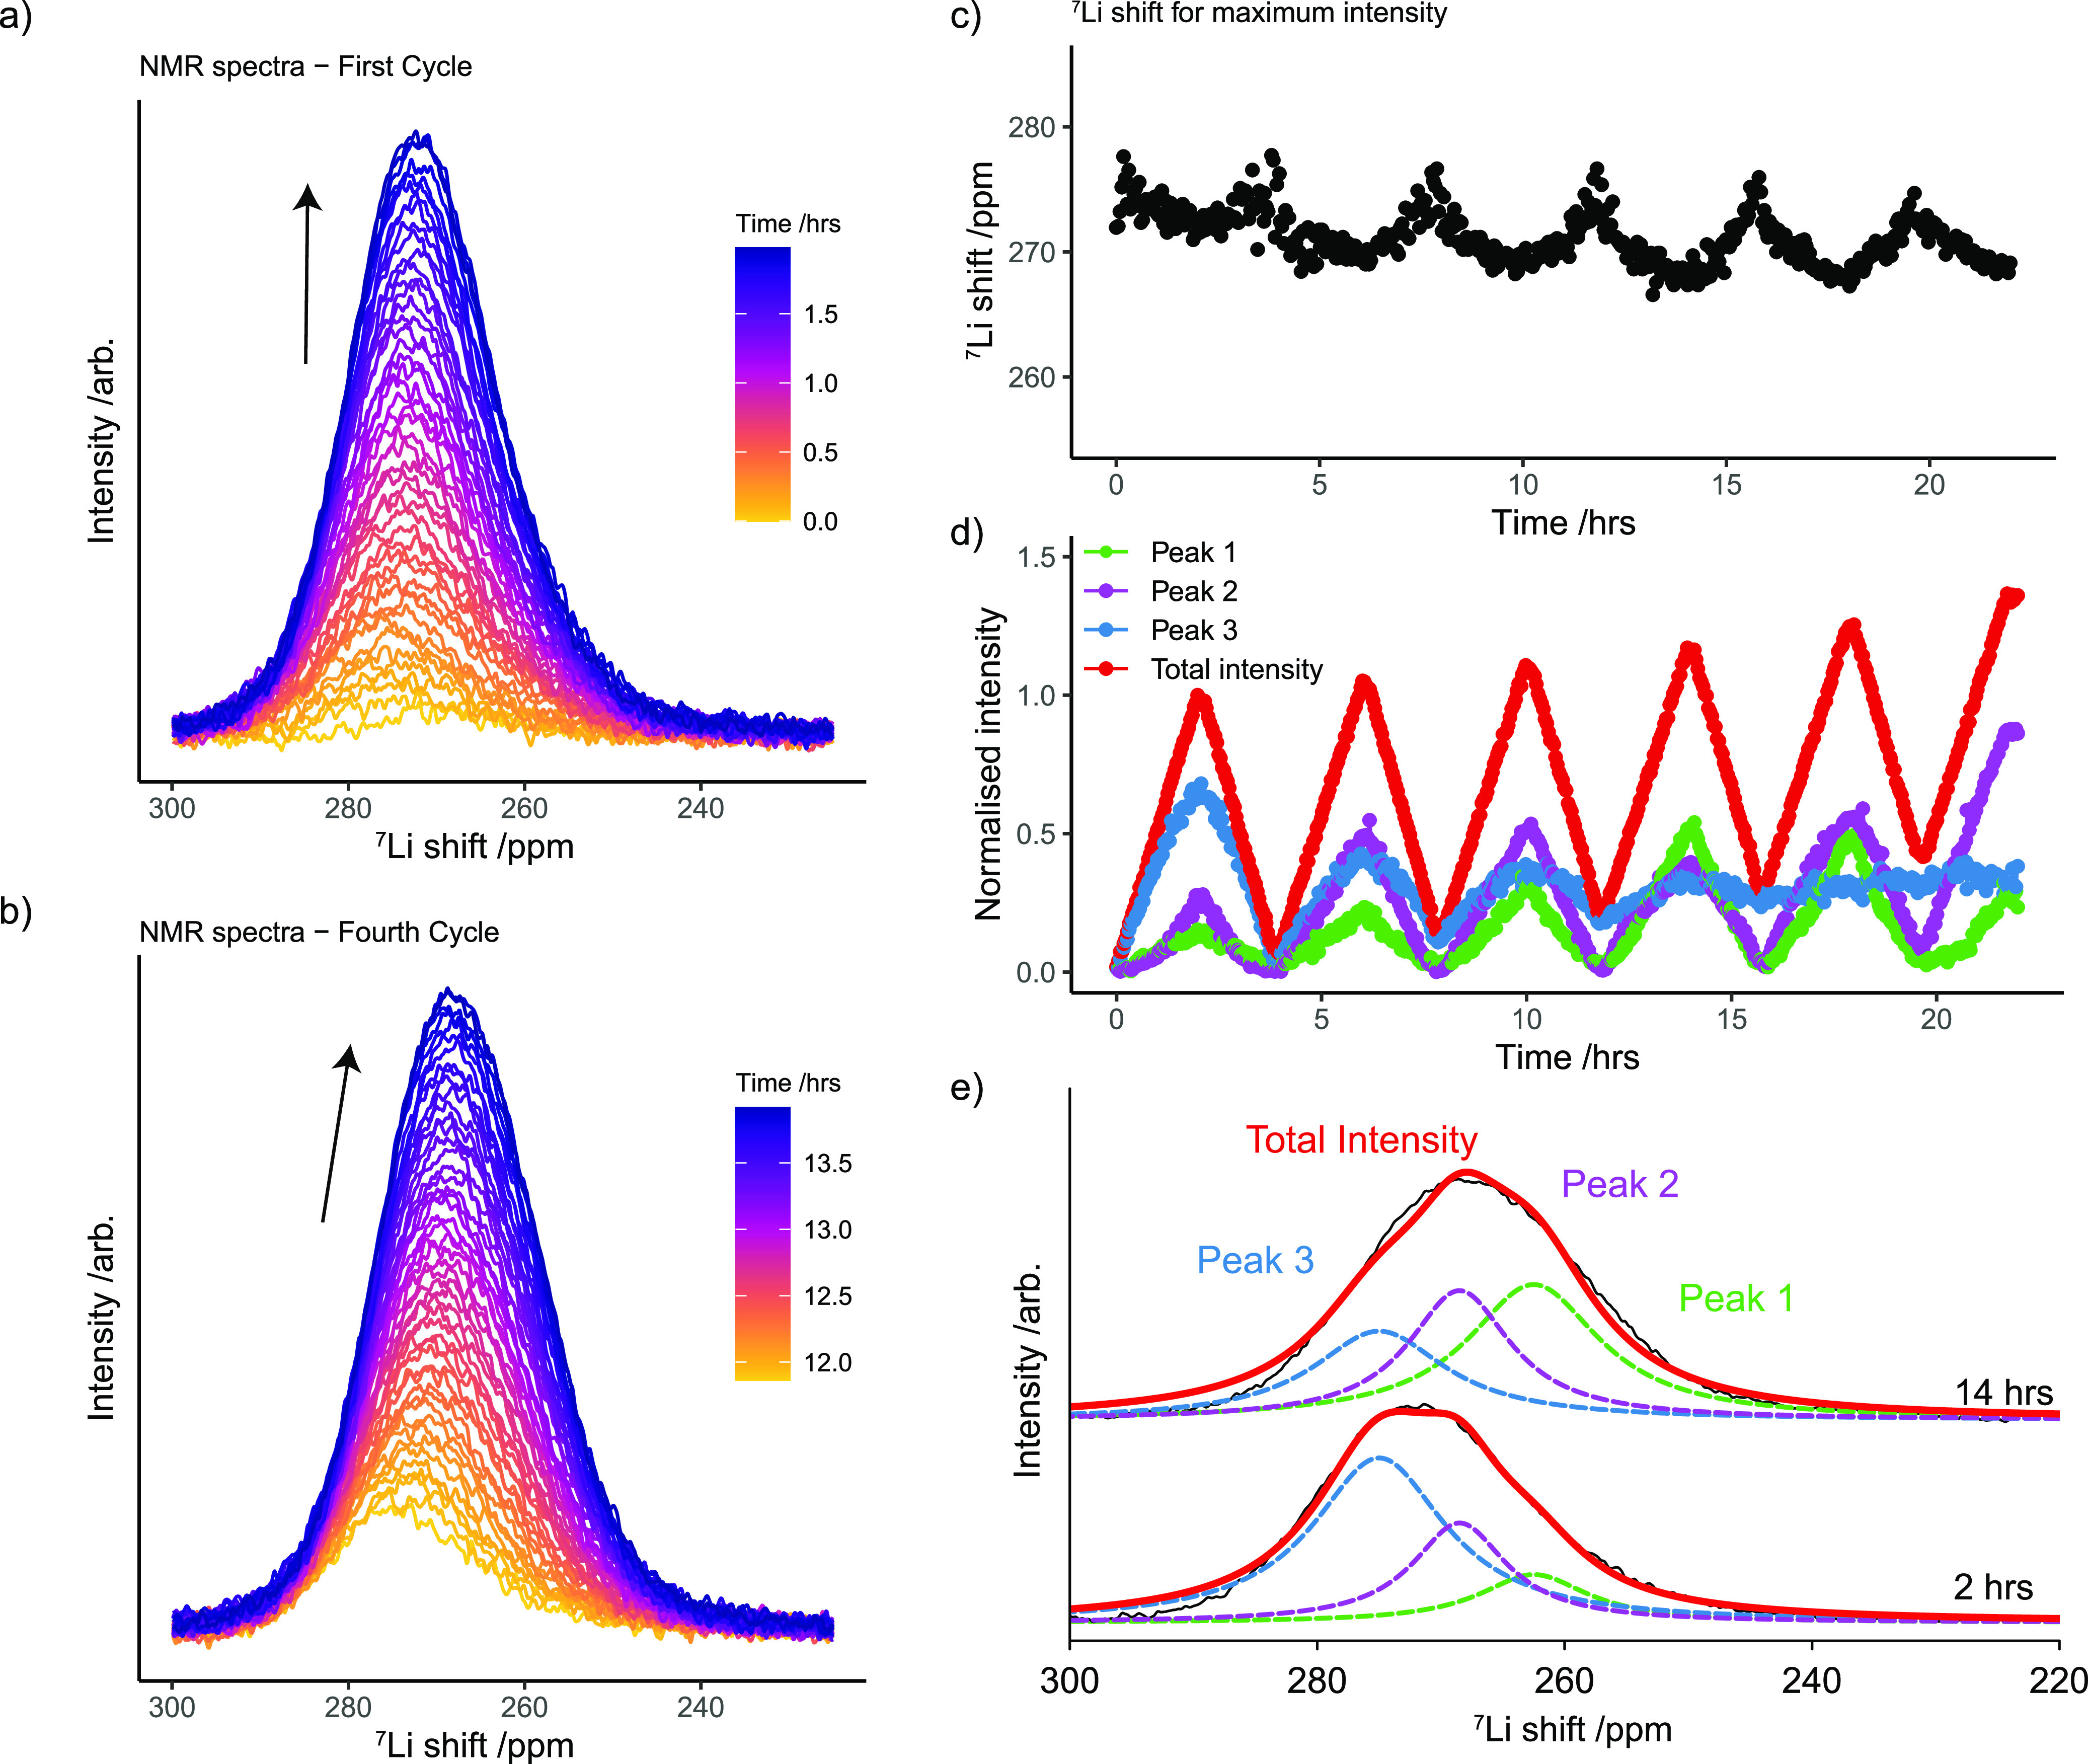
Figure 4.

BMS effects for the Li metal peak in the LP30 electrolyte. (a) Stack plot of the Li metal spectra during charge (plating) in the first cycle (where the same metal spectra are shown versus time in Figure 2a). (b) Li metal spectra during plating in the fourth cycle. (c) Frequency of the 7Li metal shift, measured at the maximum intensity of the Li metal resonance, during cycling. (d) Deconvoluted intensities of the Li metal spectra during cycling. (e) Example of the fitted spectra at the end of charge in the first and fourth cycle.
