Figure 1.
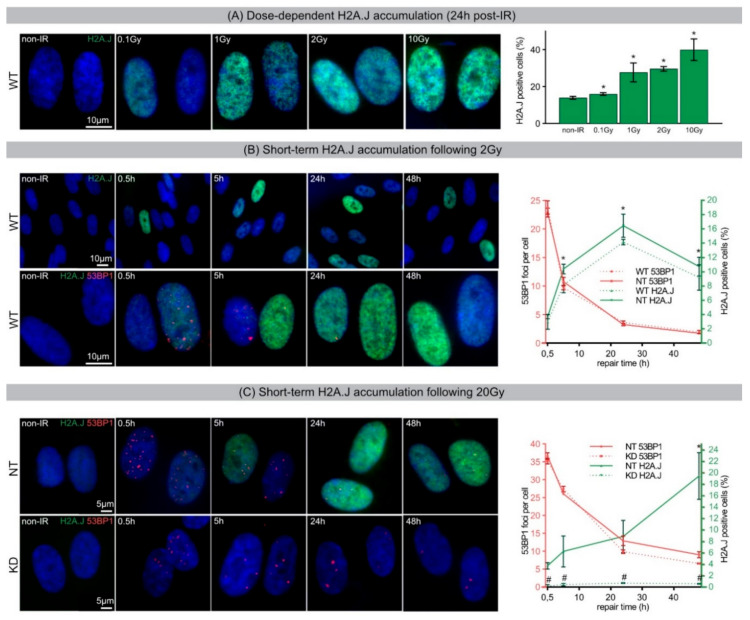
(A) Dose-dependent H2A.J accumulation (24 h post-IR). IFM micrographs of H2A.J staining in WT fibroblasts following IR exposure with varying doses (0.1, 1, 2, 10 Gy; 24 h post-IR) and accompanying quantification of H2A.J+ cells. (B) Short-term H2A.J accumulation following 2 Gy. IFM micrographs of WT fibroblasts show an acute increase of H2A.J+ cells following 2 Gy (upper panel) and the accumulation of H2A.J combined with 53BP1-foci (lower panel). Right graph shows quantification of 53BP1-foci and H2A.J+ cells in WT and NT fibroblasts (non-IR controls subtracted). (C) Short-term H2A.J accumulation following 20 Gy. IFM micrograph of NT and KD fibroblasts show the accumulation of H2A.J+ cells and 53BP1-foci following 20 Gy. Adjacent graph shows quantification of these markers (non-IR controls subtracted). Data are presented as mean of three experiments ±SE. * significant statistical difference to non-IR control (p < 0.05); # significant statistical difference to equivalent dose and time-point in NT fibroblasts (p < 0.05).

