Figure 3.
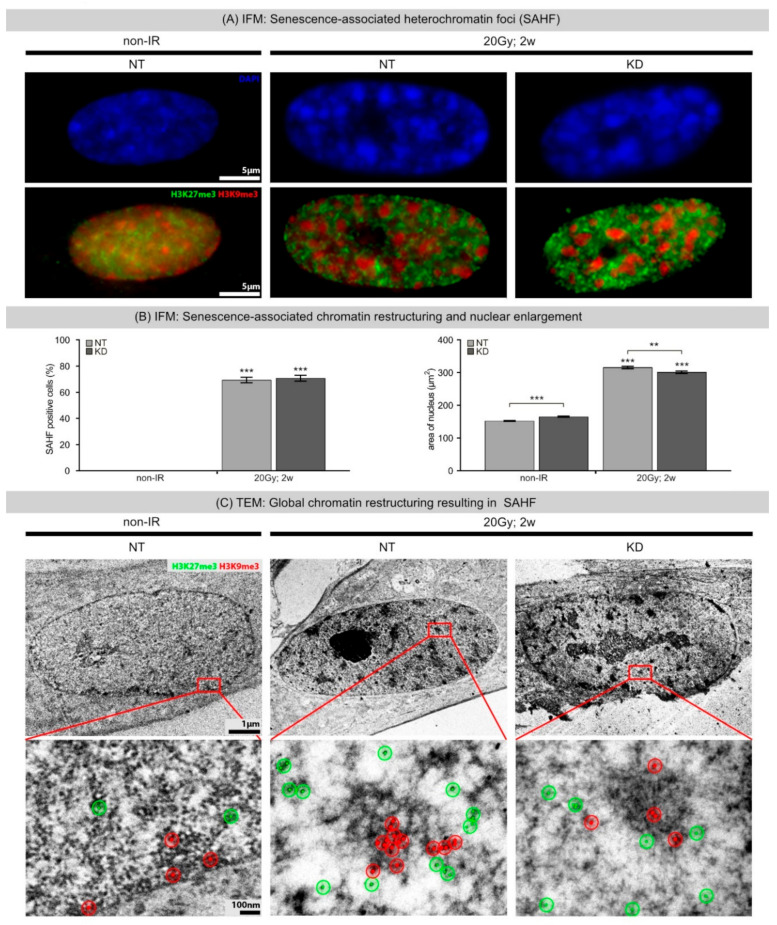
(A) IFM: Senescence-associated heterochromatin foci (SAHFs). IFM micrographs show DAPI, H3K9me3, and H3K27me3 staining of NT and KD fibroblasts following 20 Gy (2 weeks post-IR), compared to non-IR controls. (B) IFM: Senescence-associated chromatin restructuring and nuclear enlargement. Quantification of SAHF+ cells and nuclear area in NT and KD fibroblasts following 20 Gy (2 weeks post-IR), compared to non-IR controls. Data are presented as mean of three experiments ±SE. Significant statistical difference compared to non-irradiated controls (marked by asterisks alone) or between NT and KD cells (asterisks with square brackets): ** p < 0.01; *** p < 0.001. (C) TEM: Global chromatin re-structuring resulting in SAHFs. TEM micrographs show chromatin structure with immunogold-labeling for H3K9me3 (10-nm beads, red) and H3K27me3 (6-nm beads, green) of NT and KD fibroblasts following IR (20 Gy, 2 w post-IR), compared to non-IR controls. Red marked areas are shown with higher magnification. To aid visualization of gold-beads, red and green overlays were added, and bead clusters encircled.

