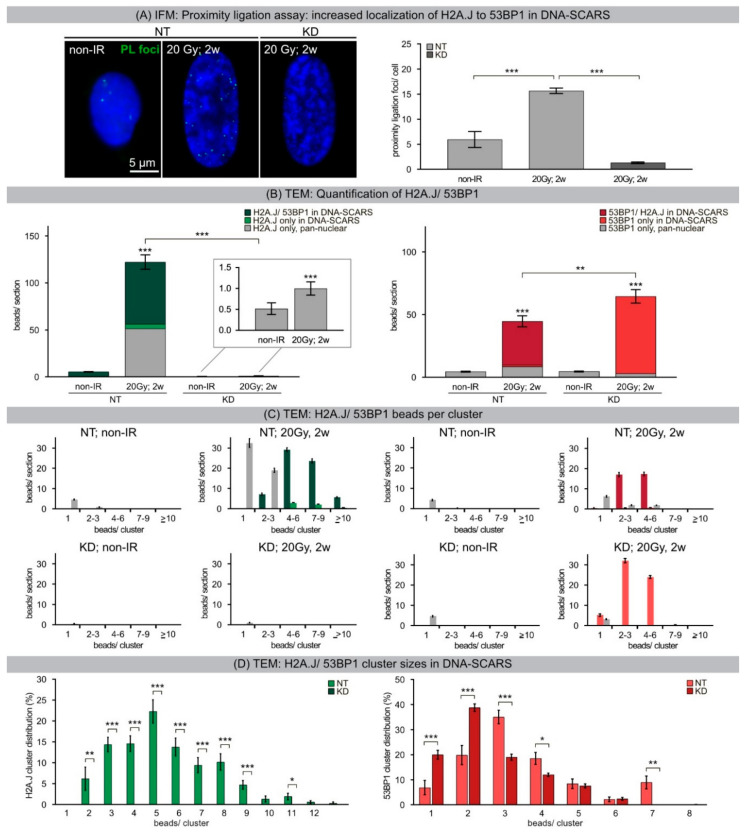
Figure 5.
(A) IFM: Proximity ligation assay: increased localization of H2A.J to 53BP1 in DNA-SCARS. IFM micrograph of proximity ligation foci generated between 53BP1 and H2A.J in NT and KD fibroblasts in non-IR control and 2 weeks after 20 Gy IR. Quantification of PLA foci in NT and KD fibroblasts in non-IR control and 2 weeks after 20 Gy. Data are presented as mean of three experiments ±SE. (B) TEM: Quantification of H2A.J/53BP1 beads. H2A.J- and 53BP1-labeled gold-beads were quantified in 25 nuclear sections of NT and KD fibroblasts after 20 Gy (2 w post-IR), compared to non-IR controls. Different colors indicate potential co-localization between H2A.J/53BP1 and spatial localization inside and outside DNA-SCARS. (C) TEM: Quantification of H2A.J/53BP1 beads per cluster. For H2A.J and 53BP1, the number of beads was quantified for different cluster sizes (1, 2–3, 4–6, 7–9, ≥10 beads/cluster) in 25 nuclear sections of NT and KD fibroblasts following 20 Gy (2 w post-IR), compared to non-IR controls. (green: H2A.J/53BP1 co-localization inside DNA-SCARS; light green: H2A.J alone inside DNA-SCARS; grey H2A.J alone outside DNA-SCARS; dark red: 53BP1/H2A.J co-localization inside DNA-SCARS; red: 53BP1 alone inside DNA-SCARS; grey: 53BP1 outside DNA-SCARS). (D) TEM: H2A.J/53BP1 cluster sizes within DNA-SCARS. Quantification of H2A.J and 53BP1 cluster size distribution as percentage of total beads within DNA-SCARS. All TEM data are presented as mean 25 nuclear sections ±SE. Significant statistical difference compared to non-irradiated controls (marked by asterisks alone) and between NT and KD cells (asterisks with square brackets): * p < 0.05; ** p < 0.01; *** p < 0.001.

