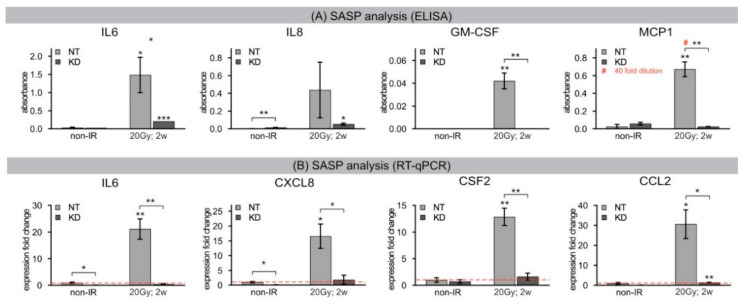
Figure 6.
(A) ELISA: SASP analysis. Quantification of SASP factors in conditioned medium of NT and KD fibroblasts analyzed 2 weeks after 20 Gy (2 weeks post-IR), compared to non-IR controls. # For MCP1 analysis NT 20 Gy, 2 weeks post-IR sample was diluted by factor 40 (10,000 cells/mL of conditioned medium) to ensure results lie within the linear range of the assay. (B) RT-qPCR: SASP analysis. Quantification of expression levels of equivalent SASP genes analyzed 2 weeks after 20 Gy (2 weeks post-IR), compared to non-IR controls. Results were normalized to GAPDH and to corresponding gene expression levels in non-IR NT controls. Red dotted line indicates the mRNA expression of non-irradiated NT cells. Significant statistical difference compared to non-irradiated controls (marked by asterisks alone) or between NT and KD cells (asterisks with square brackets): * p < 0.05; ** p < 0.01.

