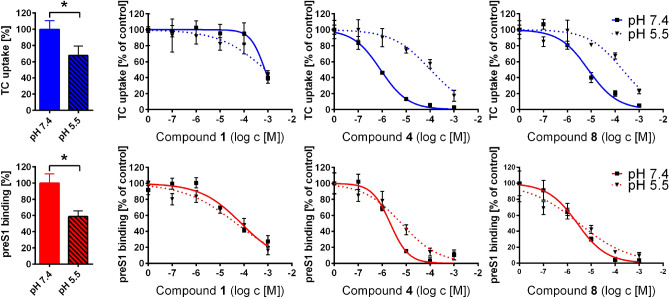
Figure 4.
Influence of pH on the inhibition pattern of acidic betulin derivatives. NTCP-HEK293 cells were incubated with tetracycline in order to induce NTCP expression and were used for bile acid transport experiments with 1 µM [3H]TC and for myr-preS12-48 lipopeptide binding experiments with 5 nM [3H]preS1, each over 10 min at 37 °C. Cells without tetracycline treatment served as control (set to 0%). Experiments were performed with solvent alone (set to 100%) and with increasing concentrations of the indicated inhibitors in the range of 0.1 to 1,000 µM at pH 7.4 and pH 5.5, respectively. Diagrams show inhibition curves at pH 7.4 (solid lines) and pH 5.5 (dashed lines). The mean of the 0% control was subtracted to calculate net [3H]TC transport rates (shown in blue) as well as net [3H]preS1 binding rates (shown in red), both expressed as % of control at the y-axis. Bar graphs show the relative [3H]TC uptake rates (blue bars) and [3H]preS1 binding rates (red bars) at pH 7.4 (filled bars) and pH 5.5 (striped bars), respectively, expressed as pmol/10 min/well. Half maximal inhibitory concentrations (IC50) were calculated by nonlinear regression analysis using the equation log(inhibitor) vs. response (GraphPad Prism). Data represent means ± SD of quadruplicate determinations (n = 4). *Significantly different with p < 0.01 (unpaired t-test with Welch's correction).

