
Figure 4. Hla Elicits SPM Formation and 15-LOX-1 Activation in M2.
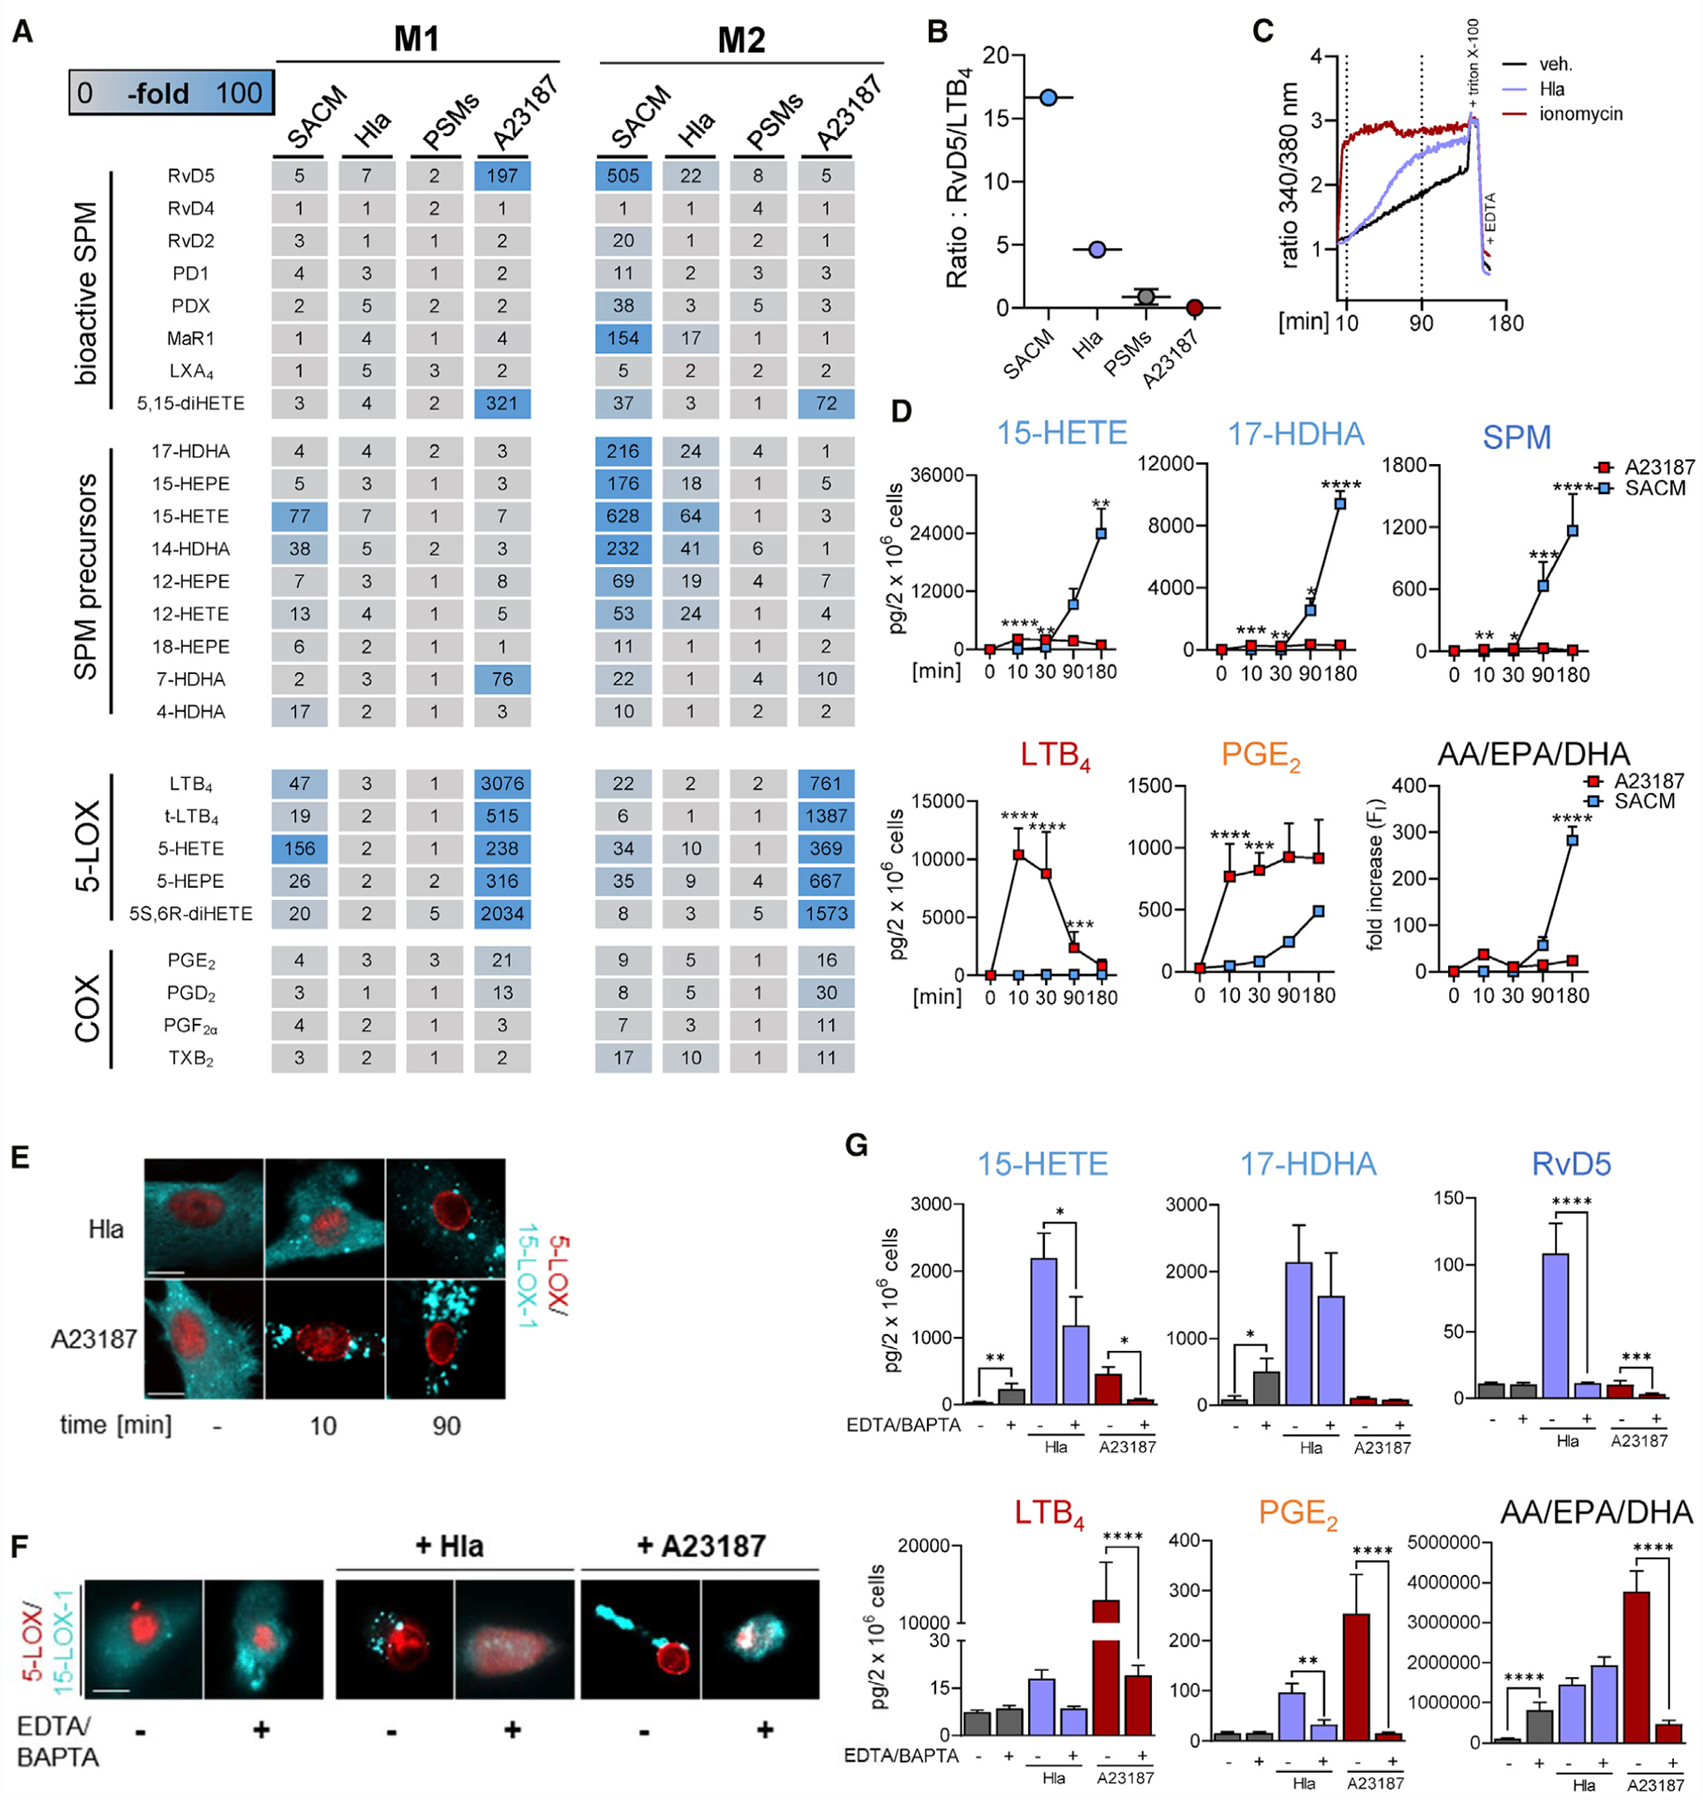
(A) LM profiles of M2s stimulated with SACM (0.5%), Hla (1 μg/mL), or PSMs (sum of 30 μg/mL PSMα3 and 10 μg/mL δ-toxin incubations) for 180 min or with A23187 (0.5 μM) for 10 min. Data are presented as fold increase to untreated control and shown as a heatmap; n = 3.
(B) Scatter dot plot of the ratio of the total amounts of RvD5 to LTB4 related to (A).
(C) Analysis of [Ca2+]i from Fura-2AM-loaded M2 treated with ionomycin (2 μM) or Hla (1 μg/mL) for up to 180 min.
(D) Time course of LM formation in M2s induced by A23187 or SACM. M2s (2 × 10⁶ cells/mL PBS plus 1 mM CaCl2) were incubated with 0.5 μM A23187 or 0.5% SACM of LS1 S. aureus at 37°C for the indicated times. The amounts of formed 15-HETE, 17-HDHA, SPM (RvD5, MaR1 and PD1), LTB4, and PGE2 are given as pg/2 × 106 cells; AA, EPA, and DHA are presented as fold increase of activated versus resting cells. Results are means + SEM, n = 3. Data were log-transformed for statistical analysis; *p < 0.05, **p < 0.01, ***p < 0.001, ****p < 0.0001 SACM versus A23187 stimulation for each indicated time point; two-way ANOVA with Sidak’s multiple comparisons test.
(E and F) Subcellular redistribution of 5-LOX and 15-LOX-1 in M2 (in PBS plus 1 mM CaCl2) stimulated with 1 μg/mL Hla or 0.5 μM A23187 for 10 and 90 min (E) and in M2s incubated in PBS containing 0.5 mM EDTA and 20 μM BAPTA/AM and stimulated with 1 μg/mL Hla for 90 min or with 0.5 μM A23187 for 10 min (F). Then, cells were fixed, permeabilized, and incubated with antibodies against 5-LOX (red) and 15-LOX-1 (cyan-blue); scale bars, 10 μm. Results shown for one single cell are representative for approximately 100 individual cells analyzed in n = 3 independent experiments (separate donors), each.
(G) Effects of Ca2+ depletion on LM formation. M2s were incubated in PBS containing 0.5 mM EDTA and 20 μM BAPTA/AM and stimulated with 1 μg/mL Hla for 90 min and with 0.5 μM A23187 for 10 min. LMs are shown as pg/2 × 106 cells. Results are means + SEM, n = 3–4; data were log-transformed for statistical analysis; *p < 0.05, **p < 0.01, ***p < 0.001, ****p < 0.0001 versus Ca2+ depletion, one-way ANOVA with Tukey’s multiple comparisons test.
See also Figure S4.