
Figure 5. ADAM10 Mediates Hla-Induced SPM Formation and 15-LOX-1 Activation.
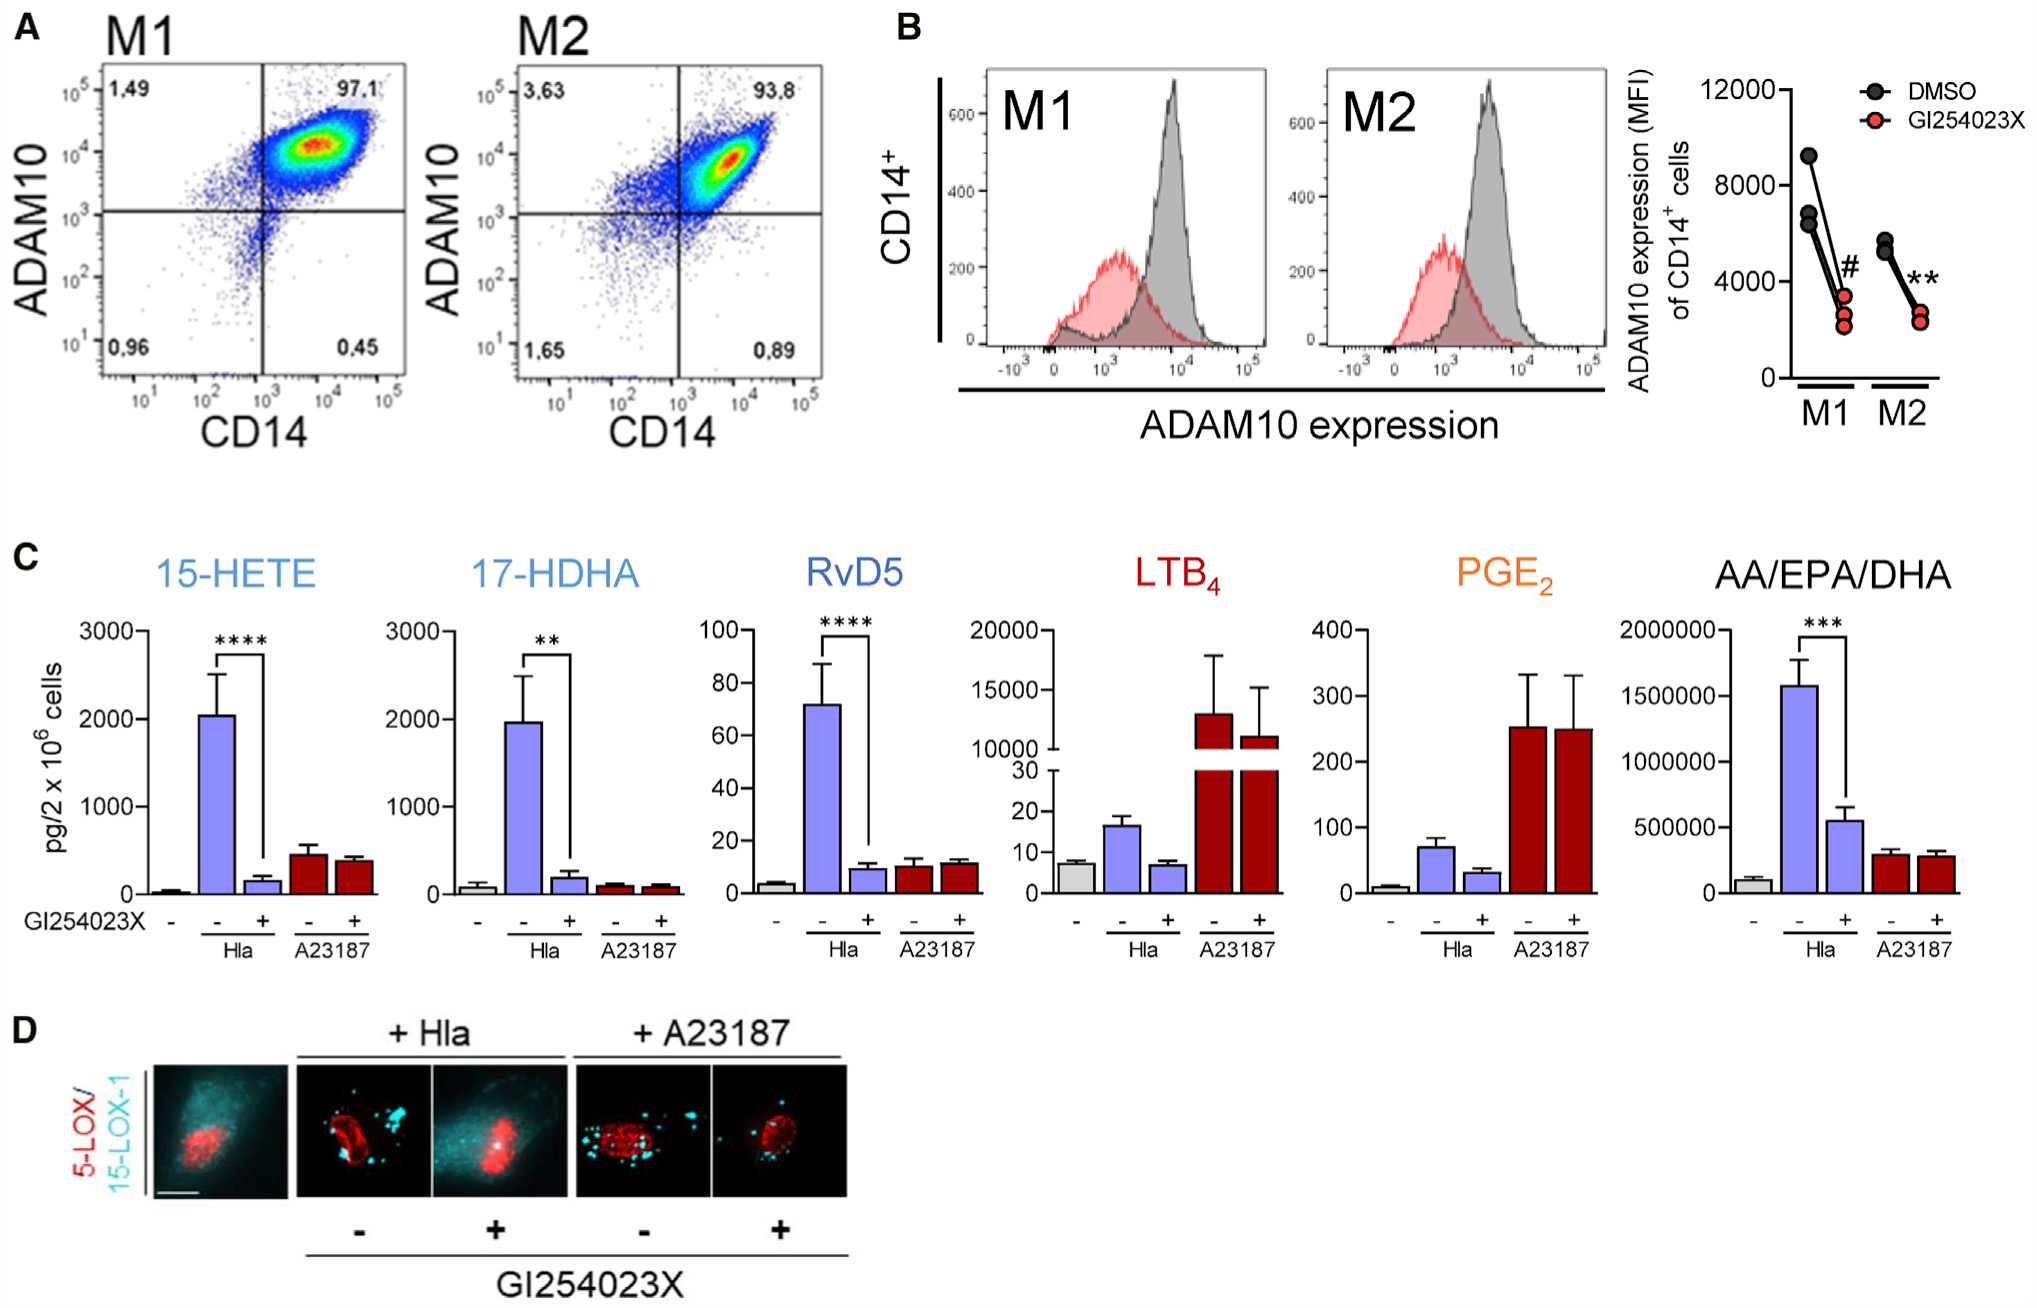
(A) Representative pseudocolor dot plots of ADAM10 expression on CD14+ M1 and M2 macrophages, measured by flow cytometry; n = 3.
(B–D) M1 or M2 macrophages (2 × 10⁶, each) were incubated during the last 24 h of polarization with 40 mM GI254023X or vehicle (0.1% DMSO). (B) Representative histograms of ADAM10 expression on CD14+ M1 and M2 after treatment with GI254023X (red) or vehicle (gray). Data are presented as MFI (mean fluorescent intensity) in a repeated-measurement dot plot; n = 3. # p < 0.05; ** p < 0.01 GI254023X versus DMSO; unpaired Student’s t test. (C) M2s (2 × 10⁶ cells) after treatment with GI254023X or vehicle were incubated for 180 min with Hla (1 μg/mL), 10 min with A23187 (0.5 μM), or vehicle at 37°C; 15-HETE, 17-HDHA, RvD5, PGE2, and LTB4 or AA, EPA, and DHA were analyzed by UPLC-MS-MS and shown as pg/2 × 106 cells. Results are means + SEM, n = 3–4; **p < 0.01, ***p < 0.001, ****p < 0.0001, GI254023X versus DMSO. Data were log-transformed for statistical analysis, unpaired one-way ANOVA with Tukey’s multiple comparisons test. (D) Subcellular redistribution of 5-LOX and 15-LOX-1 in M2 (in PBS plus 1 mM CaCl2) with or without pre-treatment with GI254023X. Cells were stimulated with 1 μg/mL Hla for 90 min or with 0.5 μM A23187 for 10 min, fixed, permeabilized, and incubated with antibodies against 5-LOX (red) and 15-LOX-1 (cyan-blue); scale bars, 10 μm. Results shown for one single cell are representative for approximately 100 individual cells analyzed in n = 3 independent experiments (separate donors), each.
See also Figure S5.