
Figure 7. Hla Evokes SPM Formation in the Peritoneum of Mice In Vivo.
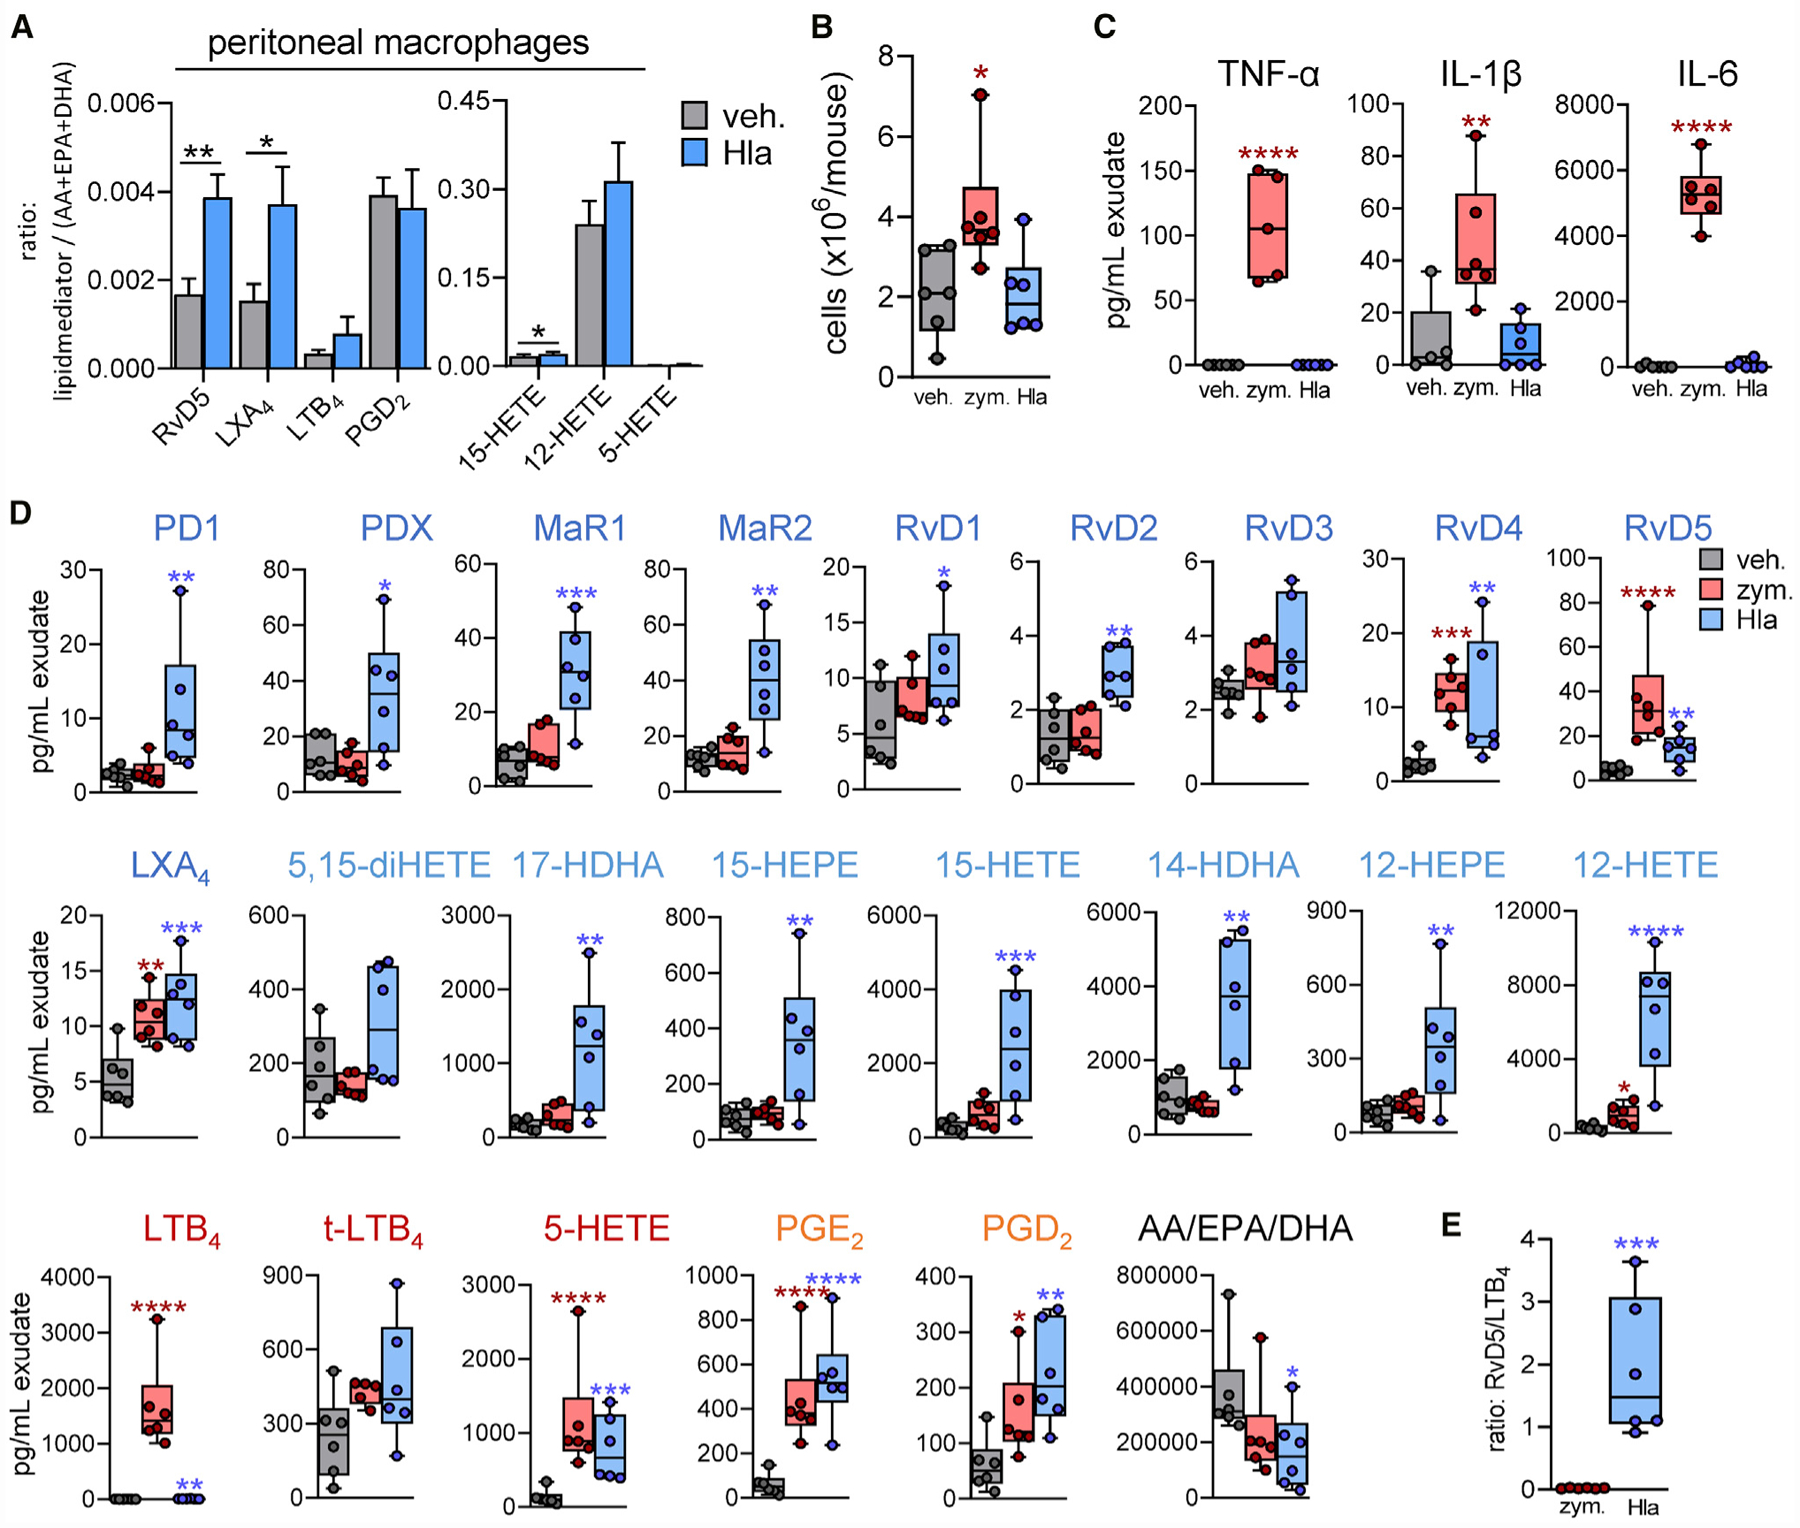
(A) Freshly isolated murine PMs were incubated for 24 h at 37°C. Then, 2 × 10⁶ cells were treated with 1 μg/mL Hla for 90 min or vehicle at 37°C; formed LMs were analyzed by UPLC-MS-MS. Results are means + SEM of the ratio of each LM against the sum of AA, EPA plus DHA; *p < 0.05, **p < 0.01 Hla versus vehicle, paired Student’s t test.
(B–E) Male mice (n = 6 per group) received 0.5 mg/kg Hla, 1 mg zymosan, or saline buffer (0.5 mL) by i.p. injection. Analysis was performed 90 min after injection.
(B) Cell infiltration in the peritoneal exudates. Results are given as cell numbers (×106/mouse); *p < 0.05 versus vehicle; unpaired one-way ANOVA with Tukey’s multiple comparisons test. (C) Cytokine levels (pg/mL) in the exudates; n = 6; *p < 0.05, **p < 0.01, ***p < 0.001, ****p < 0.0001 versus vehicle; unpaired one-way ANOVA with Tukey’s multiple comparisons test. (D) LM levels in 1 mL exudate, analyzed by UPLC-MS-MS, given in pg/mL; n = 6; *p < 0.05, **p < 0.01, ***p < 0.001, ****p < 0.0001 versus vehicle; unpaired one-way ANOVA with Tukey’s multiple comparisons test. (E) Ratio of RvD5 to LTB4 from zymosan- or Hla-treated mice; each dot represents the ratio for a single mouse; n = 6; *p < 0.05, *p < 0.01, ***p < 0.001, ****p < 0.0001 Hla versus zymosan; unpaired Student’s t test. See also Figure S6.