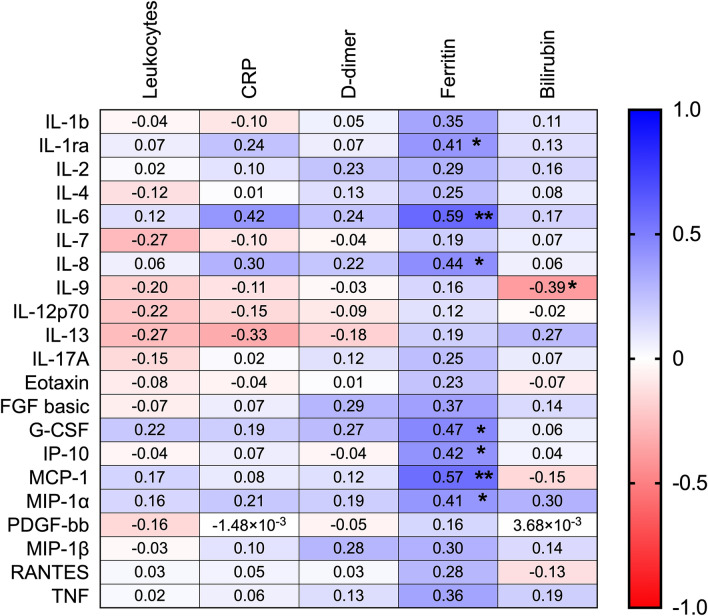
Figure 4.
Correlation between biochemistry/hematology parameters and Cytokines. Table displaying Rho values from correlation analysis. Plasma cytokine levels were correlated to leukocyte count (109/L, n = 29), CRP (mg/L, n = 29), D-dimer (n = 23), ferritin (μg/L, n = 29) and Bilirubin (μmol/L, n = 25). Correlations were calculated with Spearman correlation coefficient. Blue color indicates a positive correlation while red represents a negative correlation. Significant correlations are displayed with *. Significance * < 0.05, ** < 0.01.

