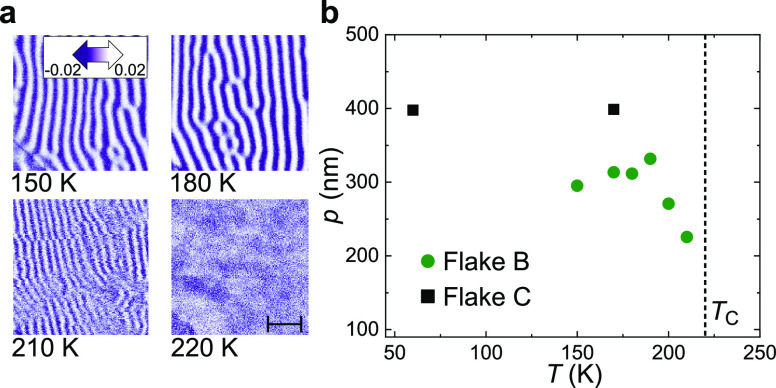
Figure 3.
Temperature dependence of the magnetic texture on the surface of FGT. (a) SEMPA images showing the mx contrast for T = 150, 180, 210, and 220 K on flake B. The in-plane magnetization direction is indicated by the arrow in the top left-hand image. The scale bar in the bottom right-hand image indicates 1 μm and holds for all images. (b) The period of the magnetization in mx is plotted as a function of temperature for flakes B and C, and TC is indicated by the dashed line.

