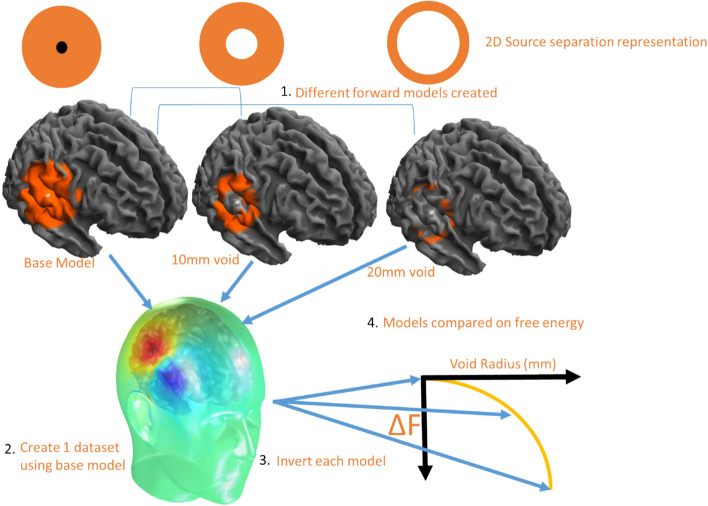
Figure 1.
Model comparison and spatial discrimination. Different forward (or target) models are created that map to brain regions that are progressively more distant to the true generator source (at centre of circle). A 2D representation is provided with the source in black and the candidate models in orange (the contents of the lead field matrix). We then reconstruct the same MEG data onto all cortical models. Each fit has an associated model evidence or free energy value. As the void radius (excluded sources) increases, the models provide increasingly less likely (as quantified by log Free energy) explanations of the MEG data. The void radius (in mm) at which the target model is 20 times less likely (log F = − 3) is a measure of the spatial discrimination.

