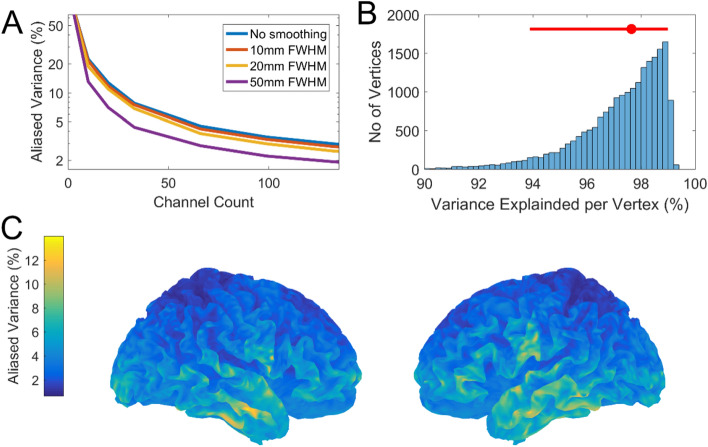
Figure 7.
The effects of aliasing. In (A) the percentage of aliased variance (from the lead field covariance matrix) is plotted as function of channel count. The Y axis is logarithmically scaled. This is repeated for different levels of source space smoothness (no smoothing, 10 mm, 20 mm and 50 mm). In (B) the histogram of variance explained across the entire cortex is calculated for an array of 100 sensors. The median variance explained (red dot) is highlighted as well as the 2.5% and 97.5% quantiles (red bar). In (C) this same information is visualised across the cortical surface to characterise the spatial profile of aliasing.

