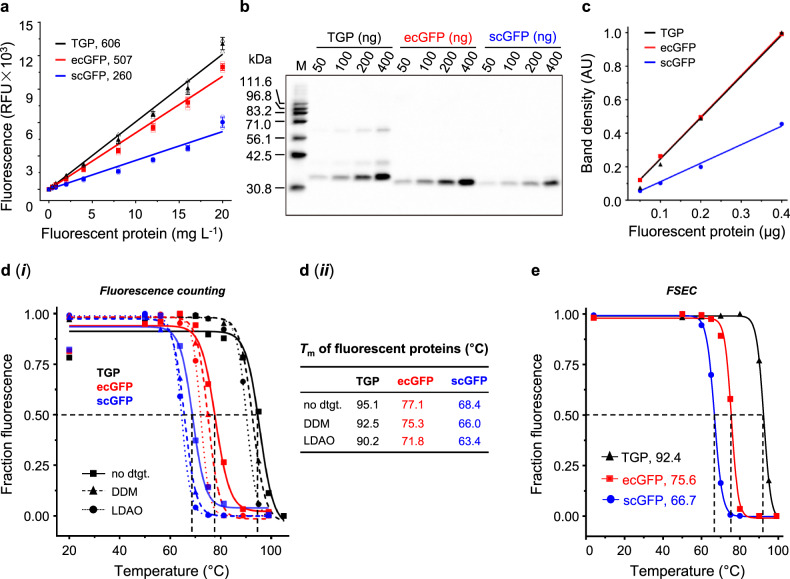
Fig. 1. TGP was brighter and more stable than GFPs.
a Linear correlation between fluorescence (in a relative unit, RFU) and concentration (in a 0.2-mL solution) with indicated slope (RFU for 1 mg L−1 of fluorescent protein). Mean and standard deviation of three independent experiments are plotted. b In-gel fluorescence image with inverted colors. M: home-made fluorescent markers14. Data are representative of two independent experiments. c Linear correlation between integrated in-gel fluorescence (in an arbitrary unit, AU) and loading using data in b. d Fluorescence counting-based melting curve (i) and Tm value (ii) of the fluorescent proteins in the absence or presence of indicated detergents (dtgt). Data are from a single experiment. e FSEC-based melting curve of the fluorescent proteins in the presence of dodecylmaltoside. Graph depicts mean of three technical replicates. The unit (°C) for Tm is omitted for all panels. In this report, all samples were heated for 20 min for Tm measurement unless stated otherwise. In panels a, c, and e, black triangle denotes TGP, red square denote ecGFP, and blue circle denotes scGFP. In d, TGP traces are black, ecGFP traces are red, and scGFP traces are blue; Solid line with square denotes samples without detergents, dashed line with triangle denotes DDM samples, and dotted line with circle denote LDAO samples. DDM dodecylmaltoside, FSEC fluorescence-detection size exclusion chromatography, GFP green fluorescent protein, LDAO lauryldimethylamine oxide, TGP thermostable GFP, Tm melting temperature.

