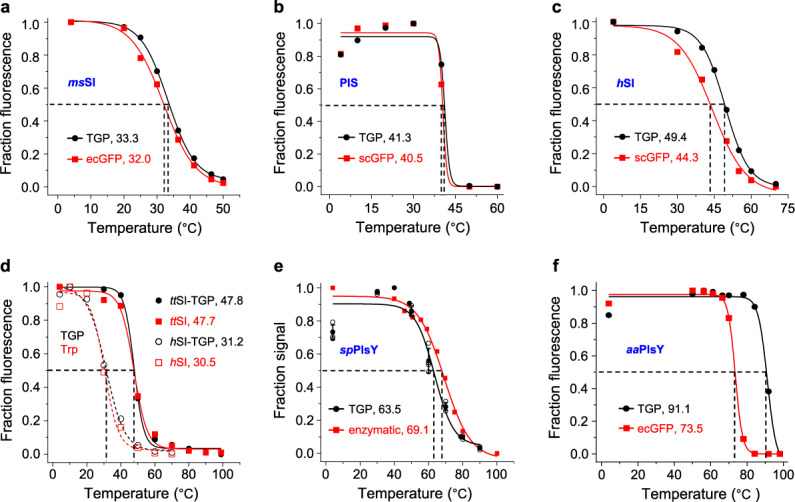
Fig. 2. TGP was a reliable and robust reporter for FSEC-TS assay.

Tm values of indicated constructs measured by different methods are shown in each panel a–f. Black circles denote data using TGP fluorescence, and red squares denote data using ecGFP (a, f), scGFP (b, c), tryptophan fluorescence (d), or enzymatic activity (e). In d, solid lines and close symbols denote ttSI samples, and dashed lines and open symbols denote hSI samples. Assays were performed using nonpurified samples except for d in which the samples had been purified using His-tag. Data are from a single experiment except for the FSEC data in e which are from four independent experiments. Standard deviation is not applicable for the data points (48.8 and 78.8 °C) because no replicates were performed for these two temperatures. To keep consistent with literature65, the heating time was 30 min for aaPlsY. The Tm difference of hSI-TGP between c and d is likely due to delipidation effect (see Discussion). FSEC-TS fluorescence-detection size exclusion chromatography-based thermostability assay, GFP green fluorescent protein, TGP thermostable GFP, Tm melting temperature.
