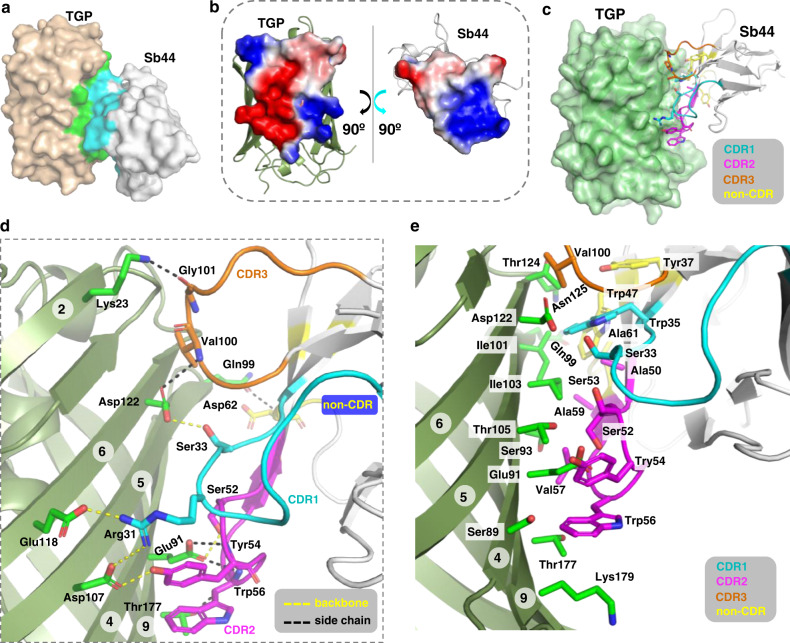
Fig. 8. Crystal structure of the TGP-Sb44 complex.
a Surface representation with interface residues colored green (TGP) and cyan (Sb44). b ‘Open-book’ representation of the electrostatic potential molecular surface generated using the Adaptive Poisson-Boltzmann Solver79 module in PyMol90. c Sb44 binds with its concave surface to TGP. Interacting non-CDR and CDRs residues are shown as sticks with carbon atoms in indicated colors. d Salt bridges and H-bonds between TGP and Sb44 with a cutoff distance of 3.9 Å. Yellow dash lines (5) indicate interactions between side chains. Black dash lines (6) indicate H-bonds that partly contributed by backbone atoms. e Hydrophobic interaction network formed by hydrophobic residues or the apolar part of hydrophilic residues. Circled numbers indicate TGP β-strands. CDR complementarity-determing region, TGP thermostable green fluorescent protein, sybody synthetic nanobody.

