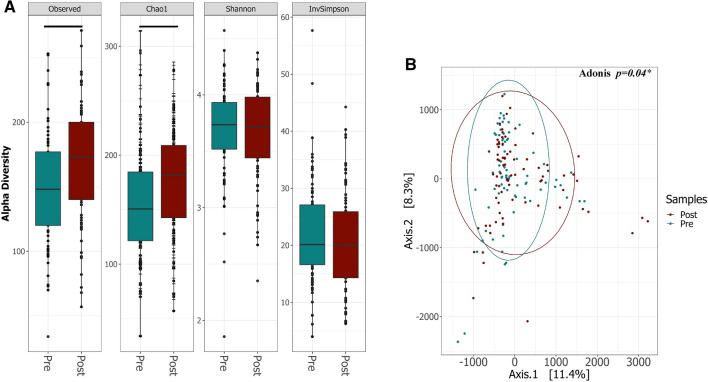
Figure 3.
Diversity of microbiota composition in stool samples pre- and post- vitamin D supplementation. (A) Boxplots of Alpha-diversity indices: Observed OTUs; Chao1; Shannon and Inverse Simpson. Boxes represent the interquartile range (IQR) between the first and third quartiles (25th and 75th percentiles, respectively), and the horizontal line inside the box defines the median. Whiskers represent the lowest and highest values within 1.5 times the IQR from the first and third quartiles, respectively. Statistical significance was identified by the Wilcoxon test with false discovery rate (FDR)-Bonferroni corrected pairwise P values. *P < 0.05; **P < 0.01; ***P < 0.001 and ****P < 0.0001. (B) PCA on a weighted UniFrac dissimilarity matrix shows significant differences in β diversity of bacterial populations pre- and post- vitamin D supplementation, with higher variance post supplementation. *P < 0.05) The figure was generated using (RStudio v 1.2 with R v 3.6)87.

