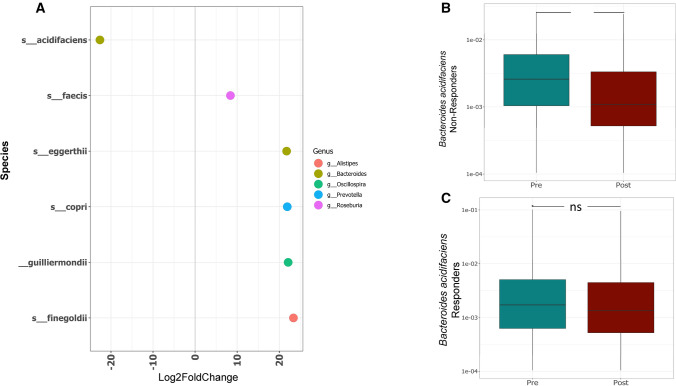
Figure 5.
Species level comparison within gut microbiota of responders and non-responders to vitamin D supplementation. (A) DESeq2 differential abundance analysis of significantly different OTUs post/pre in non-responders (p < 0.05, FDR-corrected); OTUs to the right of the zero line were more abundant in non-responders post- supplementation and OTUs to the left of the zero line were less abundant. (B–C) Comparison of relative abundance of B. acidifaciens in non-responders (B) and responders (C) pre- and post-vitamin D supplementation. Significant decrease in non-responders post supplementation (**P < 0.01). Responders show non-significant change. Statistical significance was identified by the Wilcoxon test with false discovery rate (FDR)-Bonferroni corrected pairwise P values. *P < 0.05; **P < 0.01). The figure was generated using (RStudio v 1.2 with R v 3.6)87.

