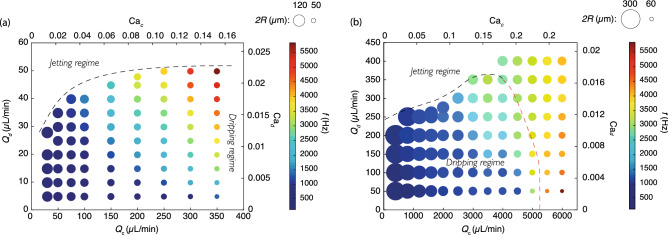
Figure 3.
Size and production frequency of water droplets in mineral oil as a function of the continuous and dispersed flow rates and , respectively, for the parameters given in Table 1, with (a) couple 1 and (b) couple 2 for the geometries. The values of the capillary numbers for the dispersed and continuous phases, as defined in Eq. (9) and with , are also given on the right and top axes, respectively. The dashed lines separate the dripping to jetting regimes. In the case the jetting regime is reached for high in the region on the right of the red dashed line in (b), it still makes sense to plot the data because of a weak polydispersity characterized by a coefficient of variation (CV) around 4%.

