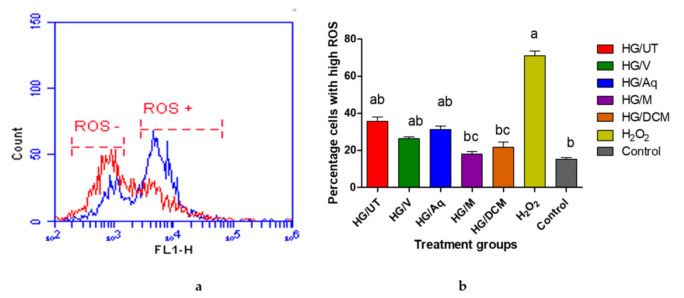
Figure 6.
Effect of vindoline and the extracts on intracellular ROS. HG/UT: untreated high glucose exposed cell; HG/V: high glucose exposed cells treated with vindoline; HG/Aq: high glucose exposed cells treated with CR-Aq; HG/M: high glucose exposed cells treated with CR-Meth; HG/DCM: high glucose exposed cells treated with CR-DCM; H2 O2: positive control; Control: cells not exposed to high glucose concentration, treated with media. (a) is a histogram that represents levels of ROS in RIN-5F cells that are untreated and treated with hydrogen peroxide. Red = Untreated, Blue = Treated. (b) is a graphical presentation of percentage ROS in cells following exposure to high glucose and respective treatments. a represents a significant difference when compared to the control at p < 0.05. b represents a significant difference when compared to the cells treated with H2O2 at p < 0.05. c represents a significant difference when compared to the cells treated with HG/UT at p < 0.05.

