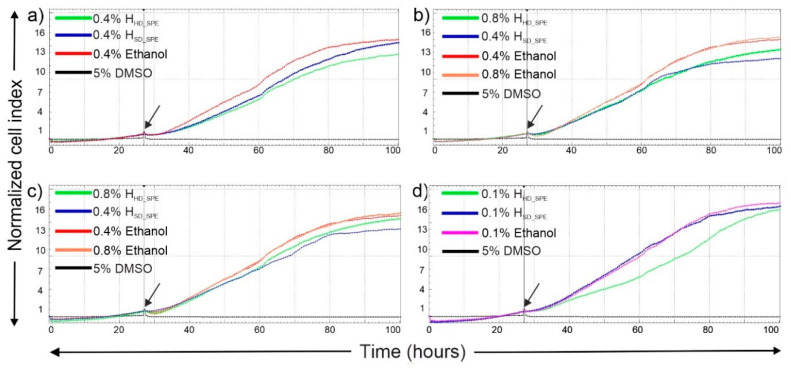
Figure 2.
Dynamic monitoring of cytotoxic response to different concentrations of the hydrolates concentrated by SPE. A549 cells were treated with selected concentrations of (a) lavender, (b) fennel, (c) bay leaves and (d) clove concentrated hydrolates. Cells treated with 0.1%, 0.4% and 0.8% ethanol were used as vehicle control and 5% DMSO treated cells were as positive control. Arrow showing time-point of treatment. Cell index values over 72 consecutive treatment hours were normalized to the time point of treatment.

