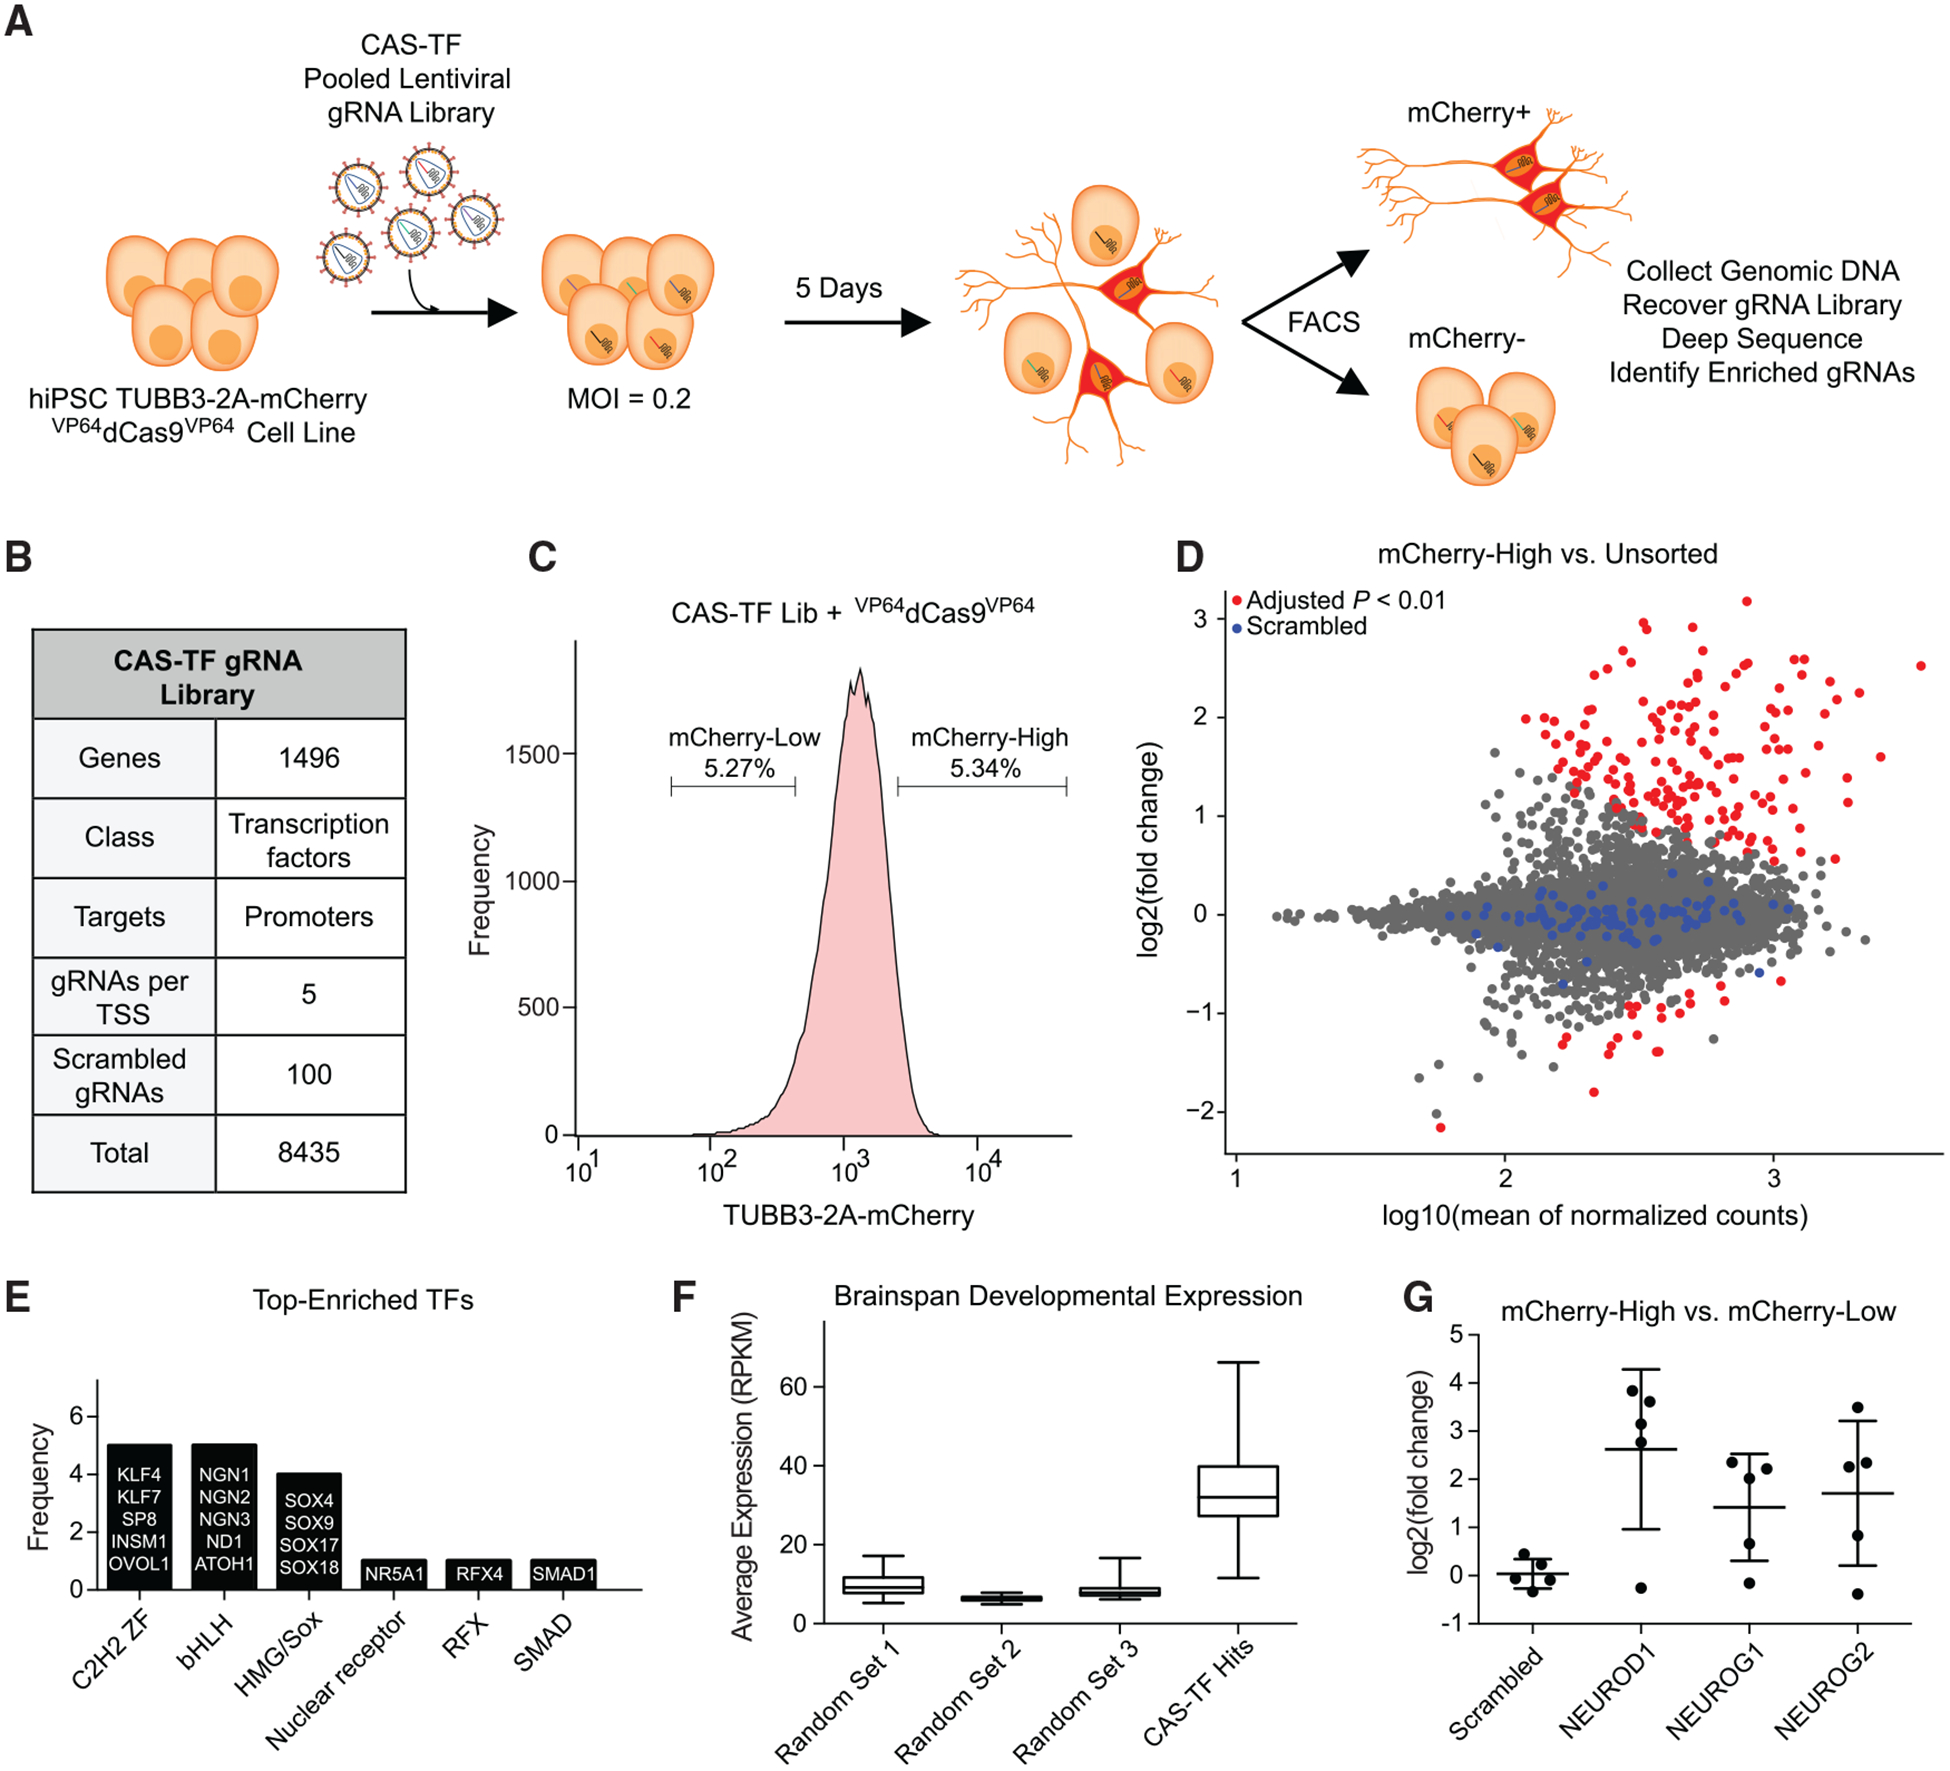
Figure 1. A High-Throughput CRISPRa Screen Identifies Candidate Neurogenic TFs.

(A) Schematic representation of a CRISPRa screen for neuronal-fate-determining transcription factors (TFs) in human pluripotent stem cells (PSCs). A VP64dCas9VP64 TUBB3–2A-mCherry reporter cell line was transduced with the CAS-TF pooled lentiviral library at an MOI of 0.2 and sorted for mCherry expression via FACS. gRNA abundance in each cell bin was measured by deep sequencing, and depleted or enriched gRNAs were identified by differential expression analysis.
(B) The CAS-TF gRNA library was extracted from a previous genome-wide CRISPRa library (Horlbeck et al., 2016) and consists of 8,435 gRNAs targeting 1,496 putative TFs.
(C) TUBB3–2A-mCherry cells were sorted for the highest and lowest 5% of expressing cells based on mCherry signal. A bulk unsorted population of cells was also sampled to establish the baseline gRNA distribution.
(D) Differential expression analysis of normalized gRNA counts between the mCherry-high and unsorted cell populations. Red data points indicate FDR < 0.01 by differential DESeq2 analysis (n = 3 biological replicates). Blue data points indicate a set of 100 scrambled non-targeting gRNAs.
(E) Analysis of TF family type across the 17 TFs identified in the CAS-TF screen.
(F) Comparison of average gene expression (Miller et al., 2014) across multiple developmental time points and anatomical brain regions for the 17 TFs identified in the CAS-TF screen and three randomly generated sets of 17 TFs.
(G) The fold change in gRNA abundance from differential expression analysis between mCherry-High and mCherry-Low cell populations for all five gRNAs from three known proneural TFs compared to a random selection of five scrambled gRNAs. See also Figure S1.
