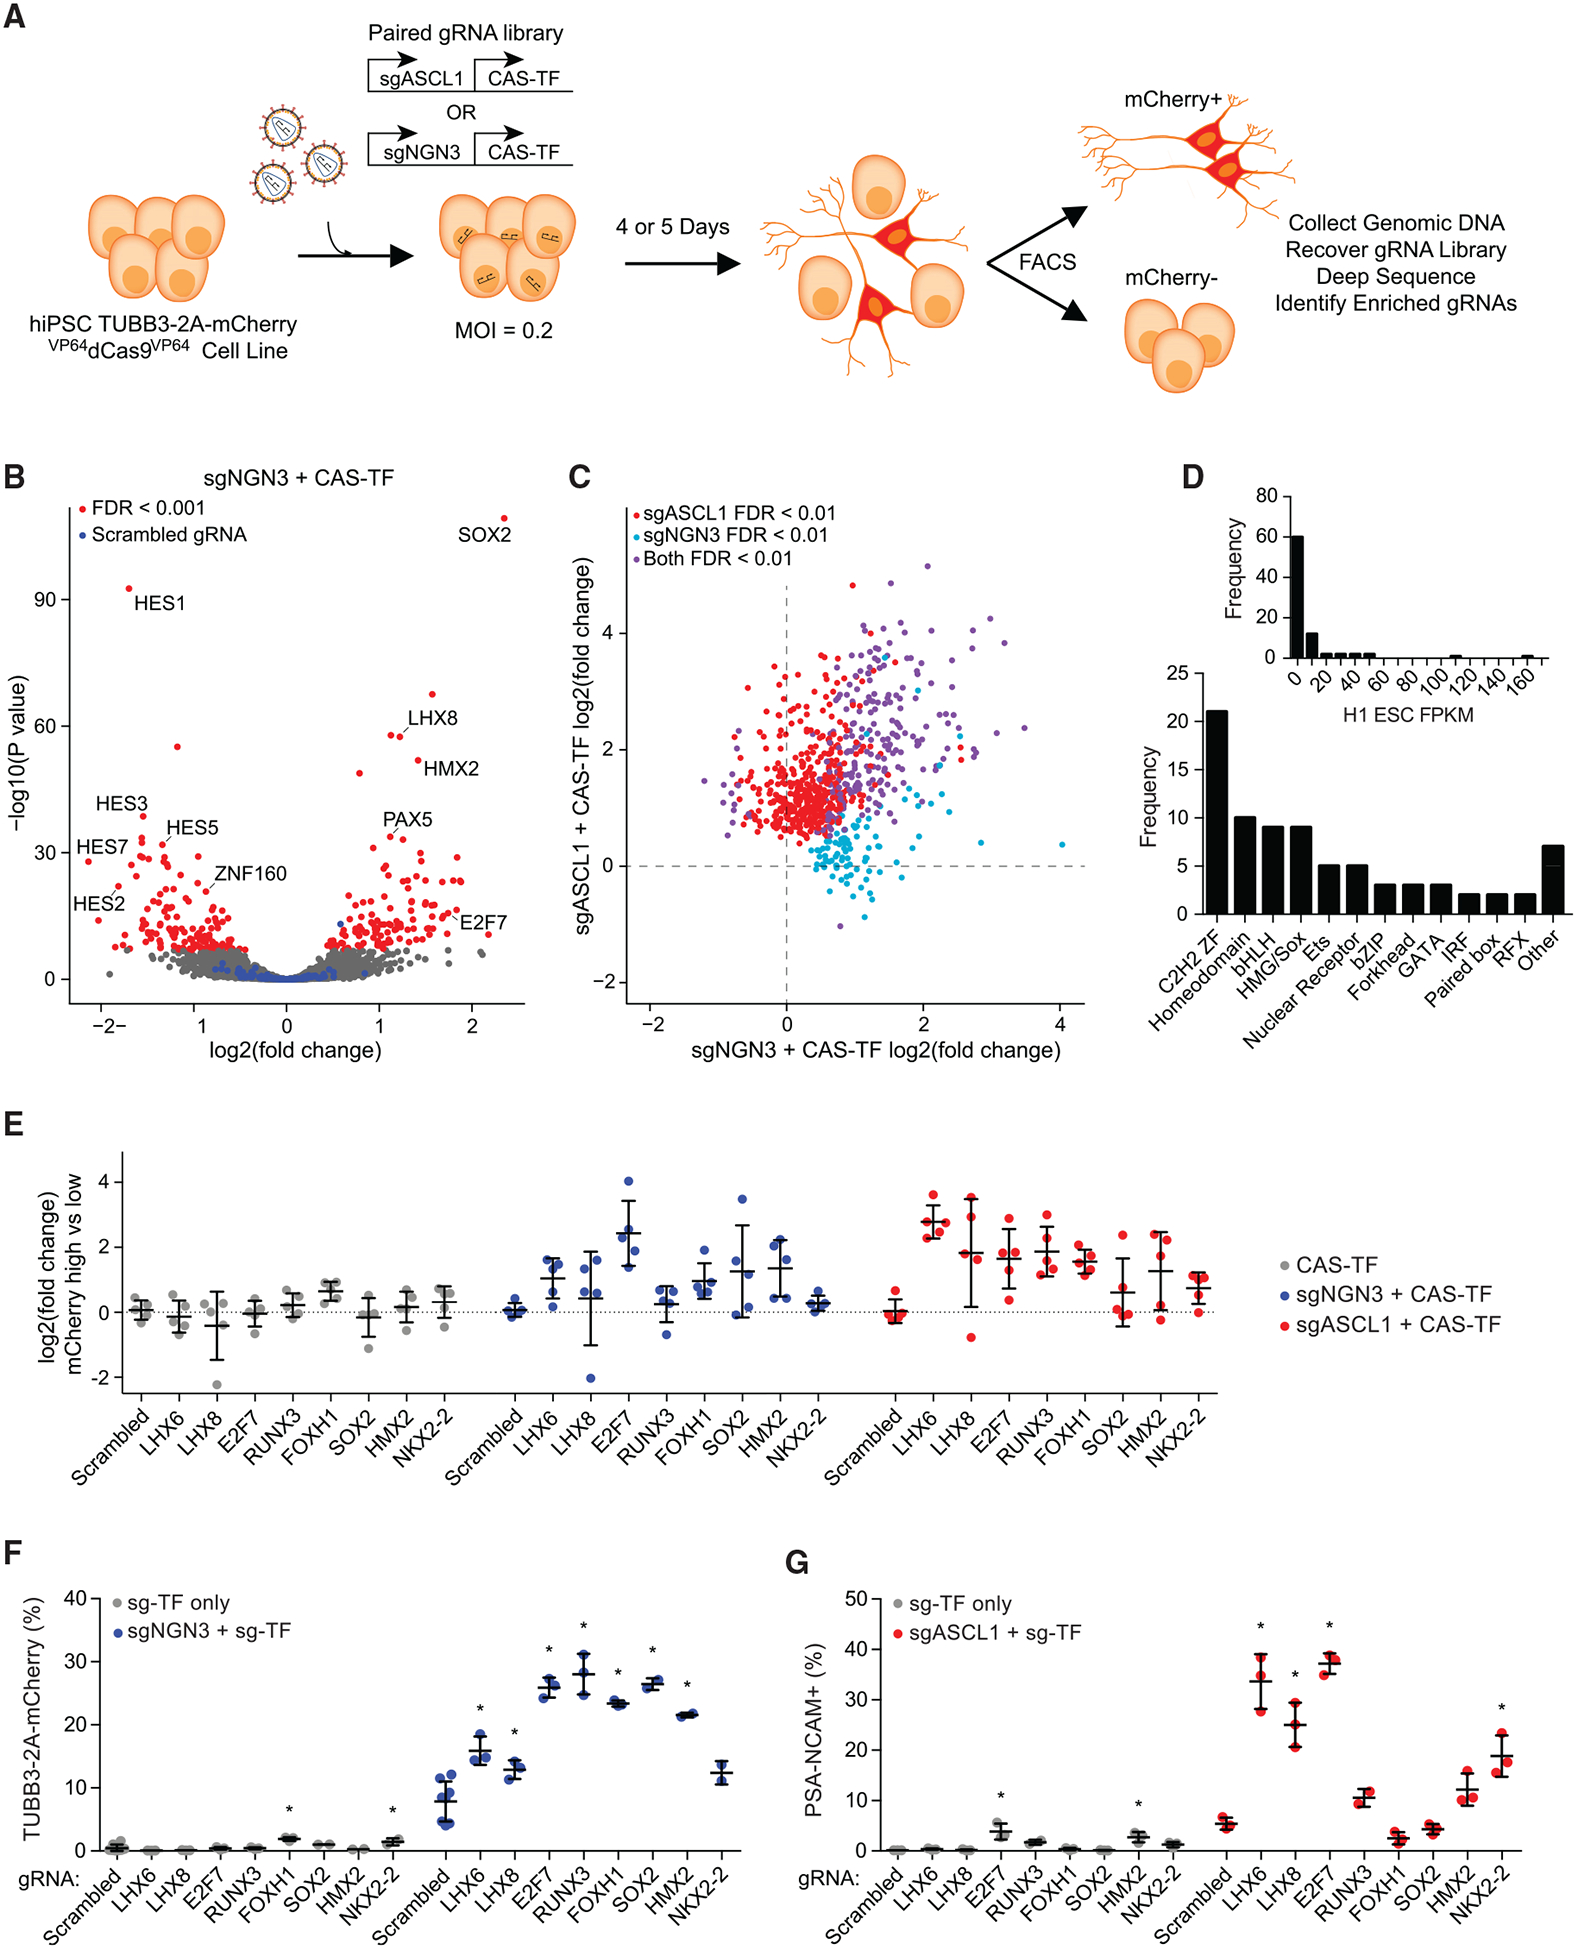
Figure 3. Paired gRNA Screens Identify Cofactors of Neuronal Differentiation.

(A) Schematic representation of paired CRISPRa screens for neuronal-fate-determining TFs in human PSCs. A dual gRNA expression vector was used to co-express a neurogenic factor with the CAS-TF gRNA library. Two independent screens were performed with sgASCL1 and sgNGN3.
(B) A volcano plot of significance (p value) versus fold change in gRNA abundance based on differential DESeq2 analysis between mCherry-high and unsorted cell populations for the sgNGN3 paired screen. Red data points indicate FDR < 0.001 (n = 3 biological replicates). Blue data points indicate a set of 100 scrambled non-targeting gRNAs.
(C) The fold change in gRNA abundance for the sgASCL1 versus sgNGN3 paired screens for all positively enriched gRNAs across both screens.
(D) Analysis of TF family type and basal expression level in PSCs (Consortium, 2012) for the positive hits from both paired screens.
(E) The fold change in gRNA abundance for a set of TFs predicted to have no activity individually and synergistic activity in the sgASCL1 and sgNGN3 paired screens.
(F and G) Validations of TF cofactors for sgNGN3 with TUBB3–2A-mCherry (F) and sgASCL1 with NCAM staining (G).
*p < 0.05 by global one-way ANOVA with Dunnett’s post hoc test comparing all groups to scrambled 1; n = 3 biological replicates; error bars represent SEM. See also Figure S5.
