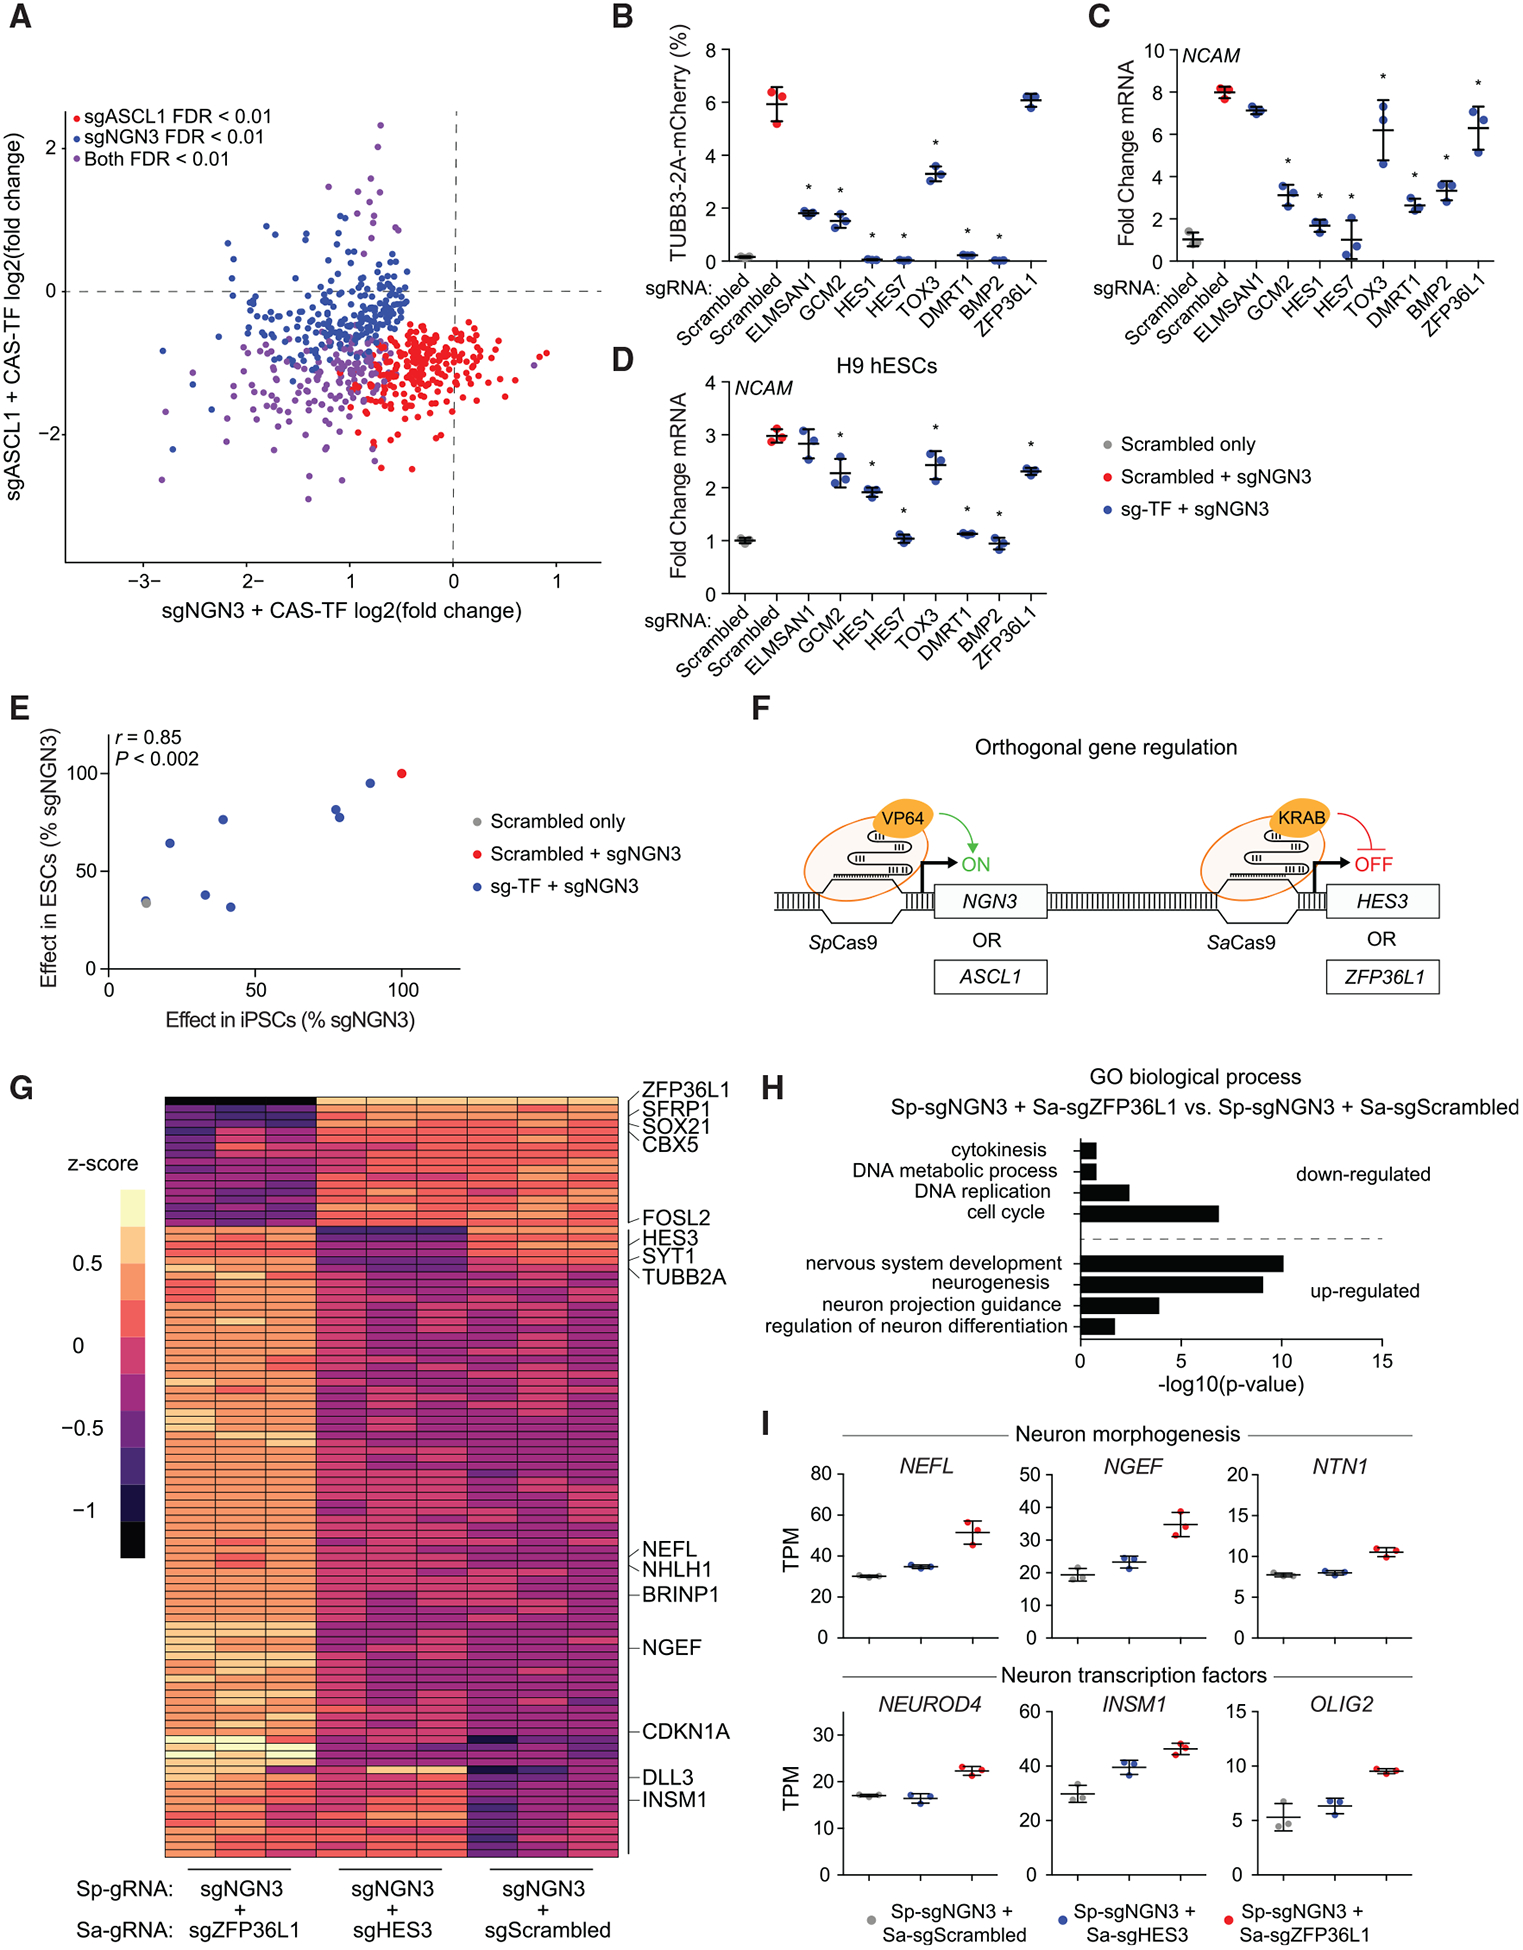
Figure 6. Paired gRNA Screens Identify Negative Regulators of Neuronal Differentiation.

(A) The fold change in gRNA abundance for the sgASCL1 versus sgNGN3 paired screens for all negatively enriched gRNAs across both screens.
(B and C) Validations for a subset of TFs measuring percent TUBB3–2A-mCherry-positive cells (B) and expression of the pan-neuronal marker NCAM (C) (*p < 0.05 by global one-way ANOVA with Dunnett’s post hoc test comparing all groups to the sgNGN3 + scrambled gRNA condition; n = 3 biological replicates; error bars represent SEM).
(D) Validations of the negative regulators in H9 hESCs.
(E) Comparison of gRNA effects on neuronal differentiation in iPSCs versus ESCs.
(F) Schematic representation of orthogonal gene activation and repression.
(G) Relative expression of the top 100 variable genes quantified by Z score among all three groups tested.
(H) GO terms enriched in the set of differentially expressed genes in sgNGN3-derived neurons with ZFP36L1 knockdown.
(I) Example set of differentially expressed genes associated with neuronal differentiation and morphological development. See also Figure S6.
