
Figure 2.
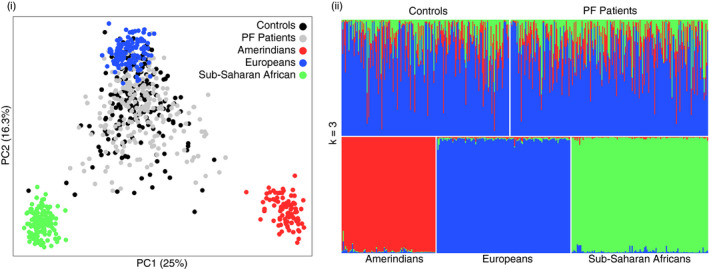
Lack of population structure in the study population. (i) Principal component analysis and (ii) bar plot of inferred ancestry proportions performed with 71 ancestry‐informative markers comparing PF patients and control samples with HGDP‐CEPH samples from three regional populations: sub‐Saharan Africans (n = 120), Amerindians (n = 83) and Europeans (n = 118) 35 .